EGBs have rallied with Treasuries and with Eurozone spreads coming in after the ECB confirmed that it will drop issuer limits in its EUR 750 bln QE program. Tapping the ESM and finally using Draghi’s OMT program are also on the cards for the Eurozone as governments try to limit the impact of the pandemic. Despite the massive US stimulus package and additional promises from European officials, stock markets headed south in Europe and US futures are also broadly lower, ahead of likely dismal US jobless claims.
The 10-year Bund yield was down -3.9 bp at -0.308%, the Gilt yield down -3.7 bp at 0.398%, and US Treasury yields had declined -6.1 bp to 0.806%. Greek 10-year rates dropped nearly 34 bp as Eurozone spreads narrowed. GER and UK100 meanwhile are both down -2.1%.
FX market volatility has been on the decline this week, as massive global stimulus has ratcheted markets away from the panic mode that prevailed last week. However the market will continue to remain subject to high volatility and overall underperformance as long as the coronavirus contagion remains in a state of increasing spread.
The plethora of global monetary and fiscal responses have helped stocks find a sustainable reprieve, however so far today as volatility remains high we have seen pullbacks. Whether these are corrections or signs of reversal, no one knows yet!
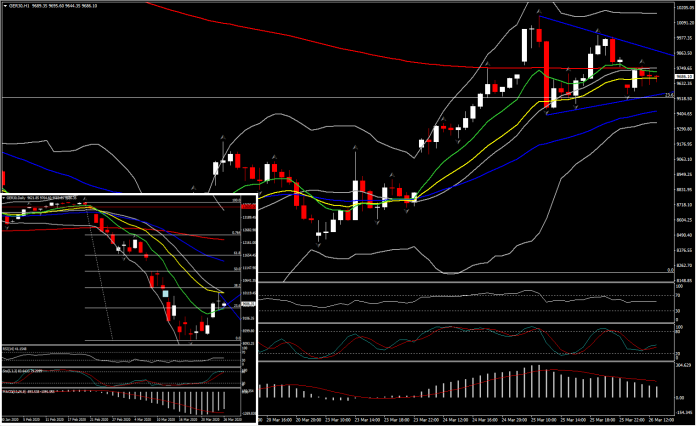
In the EU, GER30, in contrast with UK100, has gained some ground, having a distance of more than 1600 points from 7-year lows. This reflects to a more than 35% retracement, but does it look sufficient enough in order to believe in a reversal? Technically speaking, the sentiment that we have seen that last few sessions presents positive bias in the short term, with the asset holding bottom above 9,500 (23.6% Fib. level at 9,523) despite the doji Wednesday. This provides relief that 38.2% Fib is still on the cards. A breakout above the short term pennant formation could open the doors towards a retest of 38.2% Fib. retracement level at 10,358 (this could fill the March 12 gap).
In the medium term meanwhile, daily momentum indicators remain negative even though they are giving signs of weakness. RSI recovered from oversold levels but remains below neutral zone and MACD is at the negative area however it is extending above its signal line suggesting decreasing negative bias.
There is clearly plenty of volatility still to play out, but the way this move is shaping, weakness is now being bought into.
Click here to access the Economic Calendar
Andria Pichidi
Market Analyst
Disclaimer: This material is provided as a general marketing communication for information purposes only and does not constitute an independent investment research. Nothing in this communication contains, or should be considered as containing, an investment advice or an investment recommendation or a solicitation for the purpose of buying or selling of any financial instrument. All information provided is gathered from reputable sources and any information containing an indication of past performance is not a guarantee or reliable indicator of future performance. Users acknowledge that any investment in Leveraged Products is characterized by a certain degree of uncertainty and that any investment of this nature involves a high level of risk for which the users are solely responsible and liable. We assume no liability for any loss arising from any investment made based on the information provided in this communication. This communication must not be reproduced or further distributed without our prior written permission.


