Gold analysis – 16 April 2020
- How could the International Monetary Fund’s (IMF) warning of a global recession affect Gold?
- Yesterday US stocks closed in red, today Asian markets are trading lower for the second day in a row and Futures are also losing ground. Earnings season started and market risk rose again, which helped the DXY move above 100 in overnight trading.
- Today we will have the US jobless claims as well as the William (FOMC member) speech in the spotlight to have a brighter idea of the US economic situation. On the other hand, COVID-19 headlines are still driving the market.
So, how is this news going to affect Gold prices?
The question is not whether there is negative economic data, but how negative it is. Slightly negative news can help the yellow metal to rise, as there are hopes that in a short time the economy can recover at least in part. However, much weaker data will raise worries, and help the USD to rise as a main safe-haven and therefore push the gold price lower, as people will focus on getting more cash rather than investing in gold or other options. At the same time, there are some stocks that can benefit from the current situation, such as some medical companies, as well as retail sellers, as people are more willing to buy online than go to physical shops, so their stocks will also be another option, if they have some positive news and reports in the coming weeks, however, Gold is still more trusted.
Finally, if we have VIX above 60-70, which means high-risk level, it will not help the Gold Bulls that much, same as under 40, but between 40 and 60 can be a favorable risk level for Gold, which means there is still risk in the market, however, investors have a positive outlook in the meantime that the economy will recover.
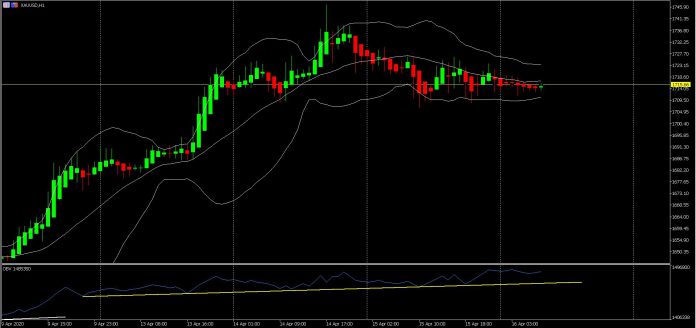
Gold technical overview – H1 chart
Bollinger bands are getting closer to each other, which signals consolidation. In the past two days, Candles have been forming mostly between the middle and lower bands of BB, supporting the bearish bias. RSI moves flat at 50, but the OBV trend line is still under the candles, supporting the bulls, the same signal of Parabolic SAR, with its dots forming under the candles. The $1704 (7-year high, seen in March) and $1724 (upper line of BB) are key Support and Resistance levels, which can confirm if the broke the next trend’s direction.
Pivot point: 1716.45
Resistance levels: 1726.00 / 1739.41
Support levels: 1703.00 / 1693.50
Today, the expected trading range is between 1693.50 support and 1739.41 resistance.
Click here to access the HotForex Economic Calendar
Ahura Chalki – Regional Market Analyst
Disclaimer: This material is provided as a general marketing communication for information purposes only and does not constitute an independent investment research. Nothing in this communication contains, or should be considered as containing, an investment advice or an investment recommendation or a solicitation for the purpose of buying or selling of any financial instrument. All information provided is gathered from reputable sources and any information containing an indication of past performance is not a guarantee or reliable indicator of future performance. Users acknowledge that any investment in Leveraged Products is characterized by a certain degree of uncertainty and that any investment of this nature involves a high level of risk for which the users are solely responsible and liable. We assume no liability for any loss arising from any investment made based on the information provided in this communication. This communication must not be reproduced or further distributed without our prior written permission.


