


The jobs report was a massive shocker and the upside beat supported the increasingly bullish tone on Wall Street over the past month. With the markets bracing for a 20% jobless rate and an -8 mln decline in nonfarm payrolls (Action Economics Survey median estimates), the markets were shocked as the unemployment rate fell to 13.3% and employment rose 2.5 mln.
Granted, a lot of the data may be suspect, and the economy is only bouncing from an unprecedented low with many headwinds still in play. Nevertheless the surprisingly robust report added to the optimism over a recovery as more states reopen. Treasury yields soared too, with the 10-year testing 0.955% and the curve steepening 5 bps to 67 bps, which added to the expectations for a real rebound in growth.
Initially, the Dollar picked up bids following remarks from China’s foreign secretary, who said that Beijing will take “countermeasures” against 33 US entities. This sparked demand for the Dollar as risk sentiment soured prior to Friday’s stronger than expected jobs report. The US currency remains down in the June by 1.7%. The Chinese news, coupled with the US jobs report and weekend, makes the Dollar ripe for a rebound. However today’s performance so far shows Dollar struggling as the Yen finds some buyers as the focus turns to the Fed decision, with the FOMC expected to re-commit to the pledge to use all available instruments to support the US economy.
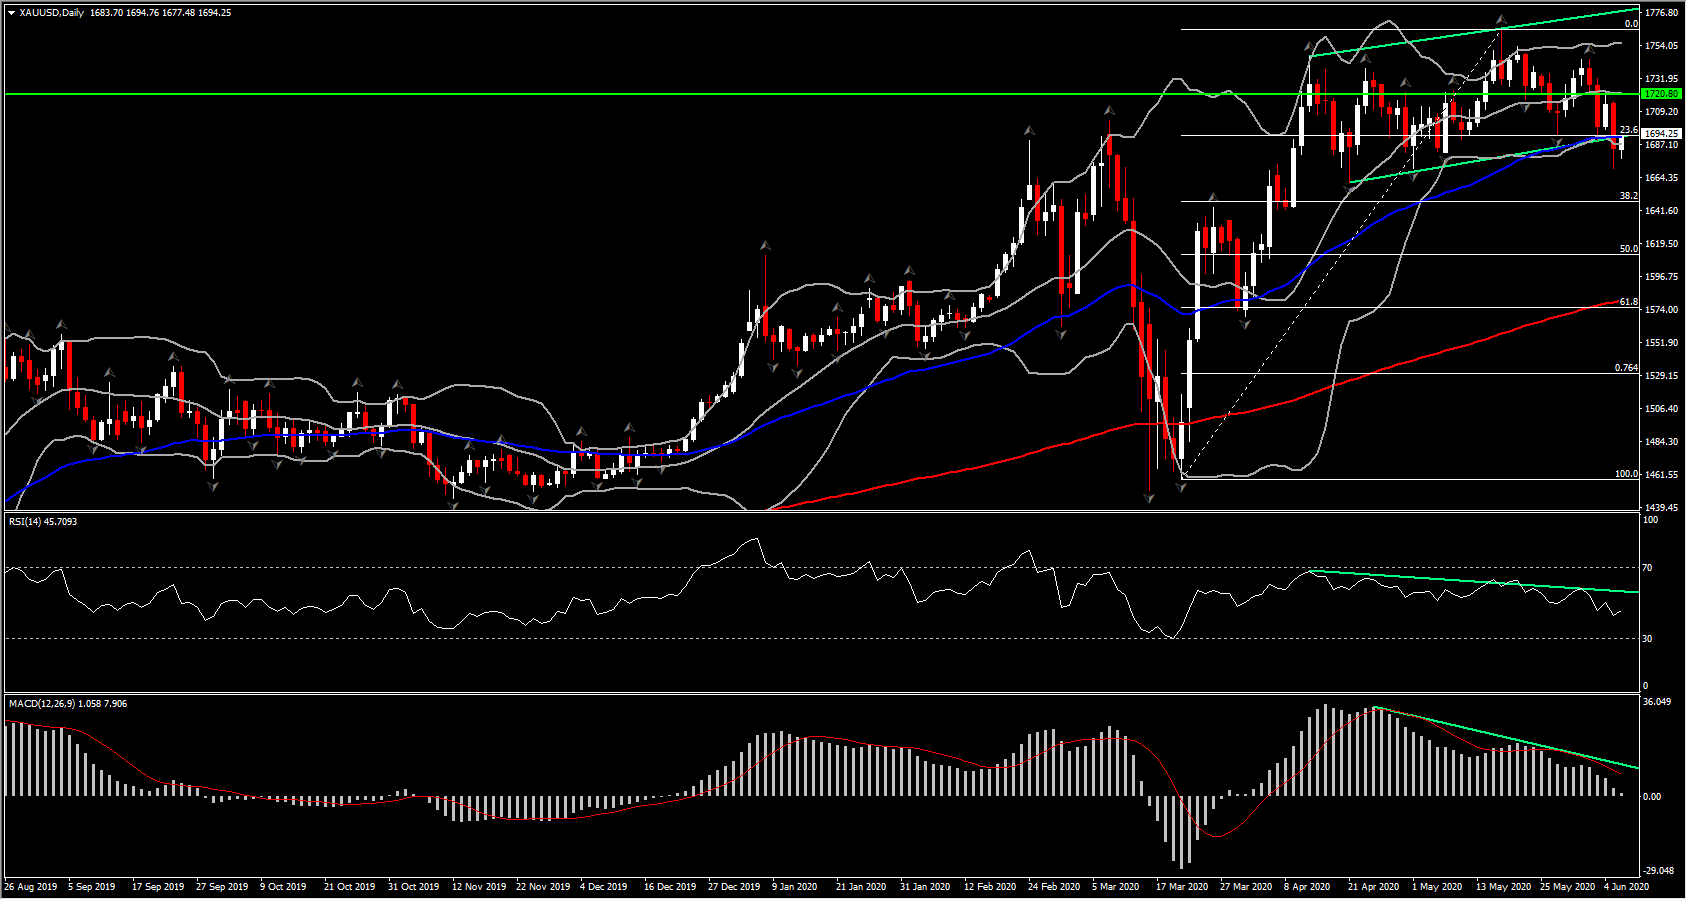
After Friday’s data, Gold sank 1.5% on the day, breaking the key $1,692 level and spreading caution for Gold investors, as a potential reversal now looks more likely than before. The asset closed below the 50-day SMA and the lower trendline of the rising wedge pattern set on April’s incline. That said, momentum indicators have shown a bearish divergence for the precious metal.
More precisely, as the price action was posting higher highs and lows, MACD and RSI were posting lower highs, signalling that the upwards trend is likely to reverse lower. As the asset moves below $1,700, the nearest resistance level is set at 20-day SMA, at $1,720, with prices likely to test the 1st and 2nd support at $1,647.50 and $1,612, 38.2% and 50% Fibonacci retracement levels respectively. Alternatively, a break above $1,720 would indicate that gold has stabilized and trigger a revisit to $1,765 on the upside.
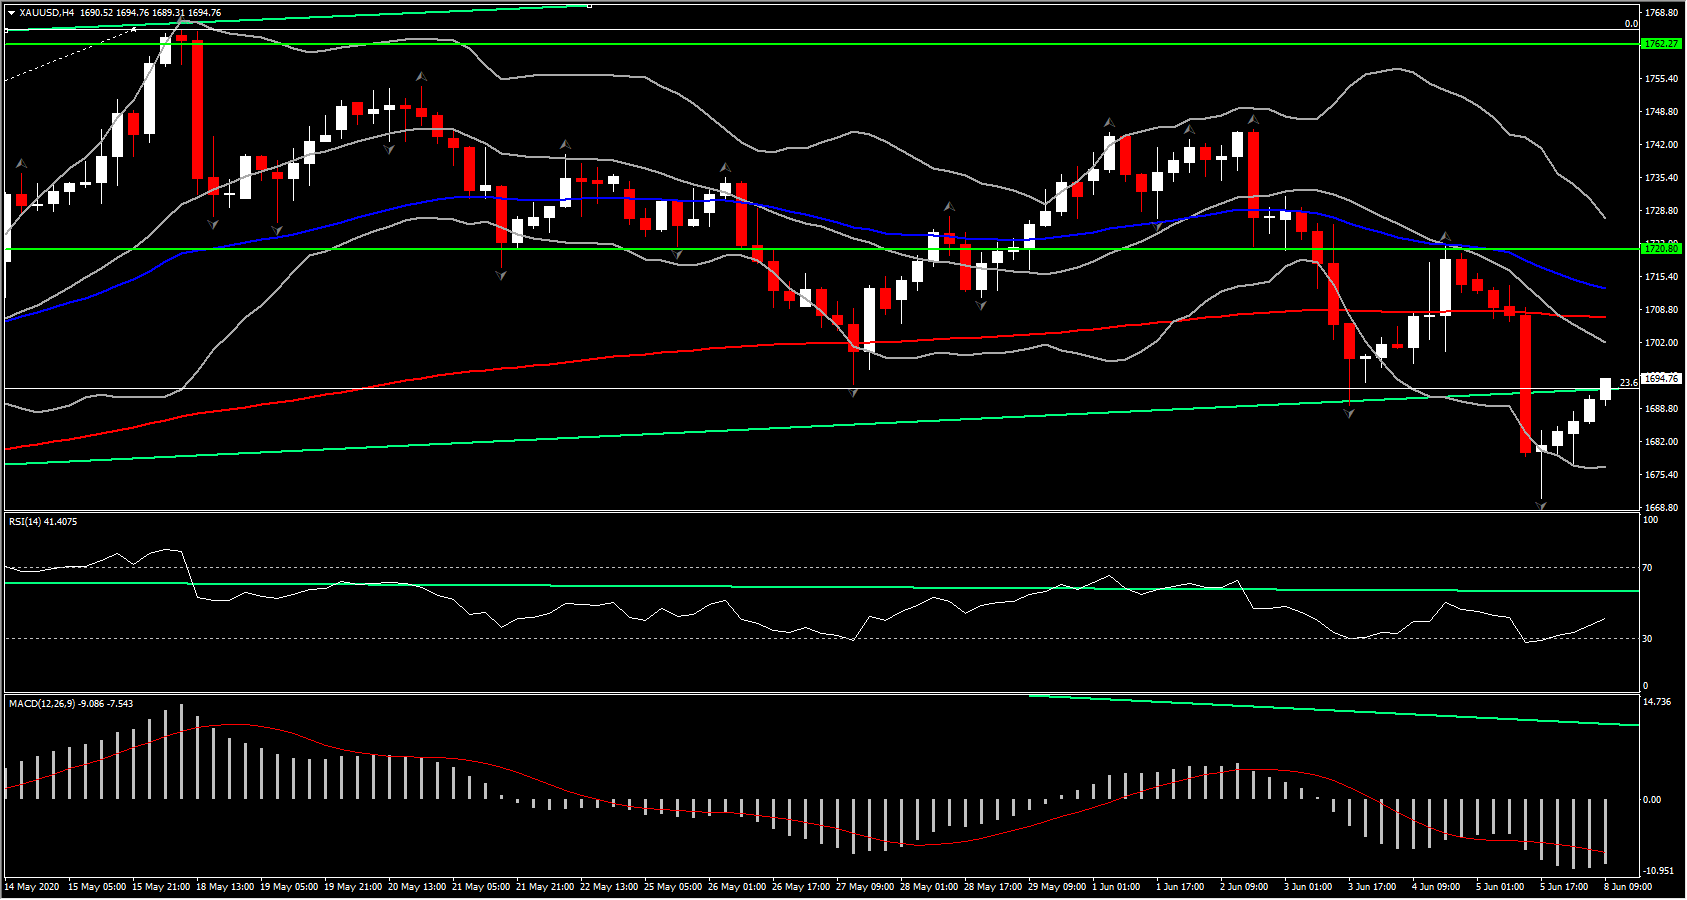
Looking at the technical indicators, the daily RSI is below neutral as 4-hour RSI is pointing slightly up but remains below neutral, suggesting that the rebound away from Friday’s lows implies a correction of the sell off seen last week. MACD is decreasing below the zero and trigger lines, strengthening the bearish divergence possibility.
Click here to access the HotForex Economic Calendar
Andria Pichidi
Market Analyst
Disclaimer: This material is provided as a general marketing communication for information purposes only and does not constitute an independent investment research. Nothing in this communication contains, or should be considered as containing, an investment advice or an investment recommendation or a solicitation for the purpose of buying or selling of any financial instrument. All information provided is gathered from reputable sources and any information containing an indication of past performance is not a guarantee or reliable indicator of future performance. Users acknowledge that any investment in Leveraged Products is characterized by a certain degree of uncertainty and that any investment of this nature involves a high level of risk for which the users are solely responsible and liable. We assume no liability for any loss arising from any investment made based on the information provided in this communication. This communication must not be reproduced or further distributed without our prior written permission.


