


Alibaba Group Holding Ltd (MT4 Symbol: ALIBABA), China’s largest e-commerce giant, is enjoying the significant growth in online activity during the lockdown caused by the COVID-19 pandemic. While the global economy faltered amid the pandemic, Alibaba (like other technology firms) reported an increase in earnings and revenue during the last reported quarter.
Alibaba is expected to report its second-quarter earnings result on Thursday 5th November Before the Market Open in New York. In the to-be-reported quarter, analysts are expecting Alibaba to post a strong revenue in its e-commerce and cloud computing business. Alibaba has made a continuous effort to add value into its core E-commerce business, as user activities (especially in China) are expected to rise due to the increased adoption of mobile devices by consumers during the lockdown. With the emergence of cloud computing as key technology to battle against the COVID-19 pandemic, the company’s cloud business witnessed higher subscription numbers and spending from enterprise customers globally in the first-quarter report and the trend is expected to continue.
The consensus earnings per share (EPS) estimate is $2.06 vs $1.85, an increase of +12.6% y/y. The estimated revenue is at $23.1 billion vs $14.97 billion (y/y), a healthy increase of 54.40%. Over the past 4 quarterly reports, Alibaba has beaten EPS estimates every time.
Alibaba shares tanked more than 8% last Tuesday as the Chinese regulator flexed its power and forced Ant Group (affiliate company of Alibaba) to halt its initial public offering (IPO) in China. However, that hasn’t changed the analyst forecast as Zacks.com still ranks Alibaba stock at #2 (BUY).
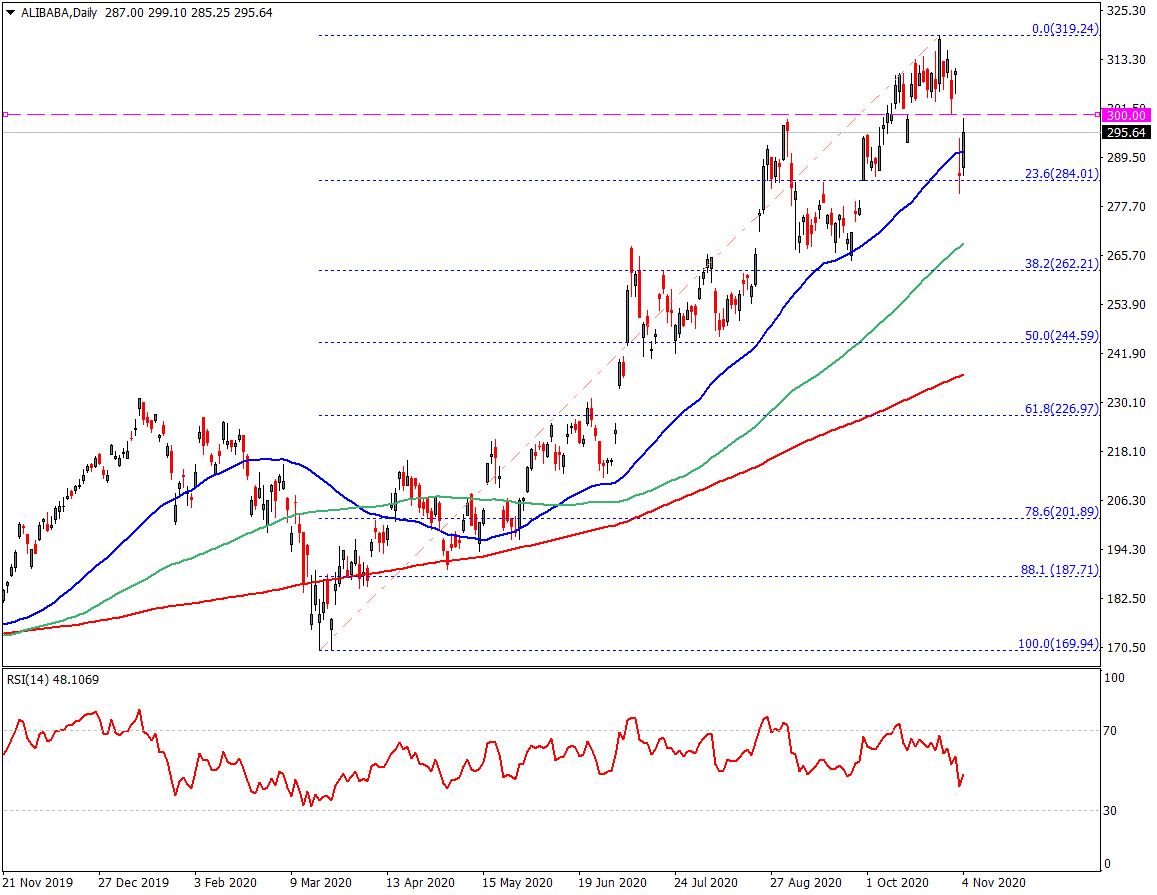
The Ant induced gap-down sent the Alibaba shares below the 50-day moving average, a level from which it has since climbed back above, closing at $295.64 on Wednesday. The highest price recorded is at $319.24 (Oct 27). On the upside, Bulls need to reclaim $300 in order to keep the momentum. However, given the uncertainty of US Presidential Election outcome and the pending earnings report, the level seems a bit too far to reach in the short term. The 23.6% Fibonacci retracement ($284.01) from the year 2020 swing low-high is the key support to watch. A break below the 23.6% fib will put the 100-day moving average in play near $268.
Click here to access the Economic Calendar
Tunku Ishak Al-Irsyad
Market Analyst, HF Education Office Malaysia
Disclaimer: This material is provided as a general marketing communication for information purposes only and does not constitute an independent investment research. Nothing in this communication contains, or should be considered as containing, an investment advice or an investment recommendation or a solicitation for the purpose of buying or selling of any financial instrument. All information provided is gathered from reputable sources and any information containing an indication of past performance is not a guarantee or reliable indicator of future performance. Users acknowledge that any investment in Leveraged Products is characterized by a certain degree of uncertainty and that any investment of this nature involves a high level of risk for which the users are solely responsible and liable. We assume no liability for any loss arising from any investment made based on the information provided in this communication. This communication must not be reproduced or further distributed without our prior written permission.


