


AbbVie Inc. (ABBV) will submit its earnings report for Q420 on February 3, 2021, before the market opens. This public company, located in North Chicago, Illinois in the USA is engaged in the pharmaceutical industry, a part of the overall healthcare sector that is felt to have benefited from the impact of the pandemic. AbbVie’s products in the Immunology, Oncology, Imbruvica, Venclexta, Aesthetic segments, Neuroscience segments and Botox Therapeutics, etc, that contributed to revenue in the previous quarter, are estimated to make a large contribution to this year’s income report.
In its previous earnings report for the third quarter, AbbVie announced earnings results with an EPS of $2.83 for Q320, beating the consensus estimate of $2.75. It also reported Q320 revenue value of $12.88 billion vs the consensus estimate of $12.71 billion. Its quarterly revenue is up 51.9% compared to the same quarter last year. AbbVie has made $8.94 earnings per share over the past year and currently has a price-earnings ratio of 21.5. (Source: ABBV)
Zacks Investment Research gave an EPS estimate for the fourth quarter of 2020 of $2.85. The reported EPS for the same quarter last year was $2.21.
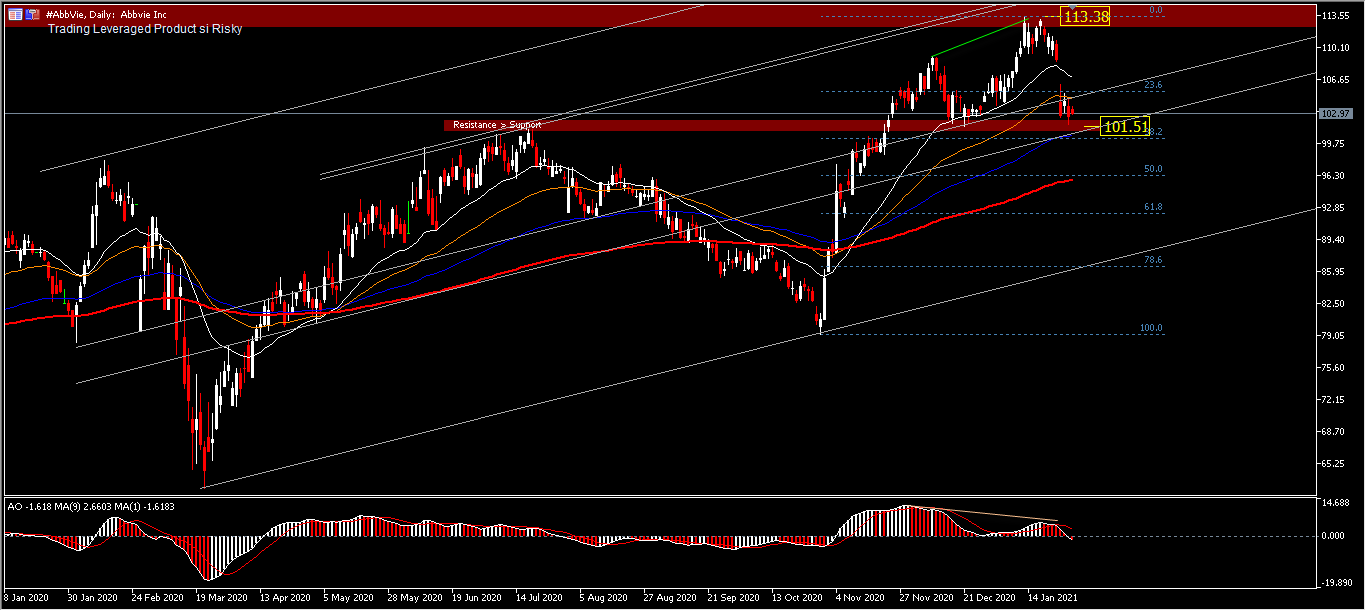
D1 – AbbVie’s share price at the beginning of January 2021 recorded an increase of 6.27%, but closed lower at the end of the month by 9.5%. The peak price of 113.38 formed in January 2021 is a new 3-year high, with the previous highest peak price formed in 2018 at 125.79. At today’s opening price, it also looks weak, approaching the support at 101.51 which was previously a resistance level. The price is still moving in the ascending channel, but the movements of the last few days give an indication of decreasing momentum. This can be seen from the price moving below the 50-day average (orange) and the clear AO divergence. For now the price is entering an important level, which is the level of balance between past resistance and current support. A break of the support level 101.51 will bring a decline to the retracement level of 50.0% near the 200-day EMA. As long as the support holds, the bias should remain positive for a return to 106.12 and the top price at 113.38.
Click here to access the HotForex Economic Calendar
Ady Phangestu
Analyst – HF Indonesia
Disclaimer: This material is provided as a general marketing communication for information purposes only and does not constitute an independent investment research. Nothing in this communication contains, or should be considered as containing, an investment advice or an investment recommendation or a solicitation for the purpose of buying or selling of any financial instrument. All information provided is gathered from reputable sources and any information containing an indication of past performance is not a guarantee or reliable indicator of future performance. Users acknowledge that any investment in Leveraged Products is characterized by a certain degree of uncertainty and that any investment of this nature involves a high level of risk for which the users are solely responsible and liable. We assume no liability for any loss arising from any investment made based on the information provided in this communication. This communication must not be reproduced or further distributed without our prior written permission.


