Today’s ADP overshoot of the payrolls estimate signals upside risk for Friday, especially given the pattern of big ADP undershoots of the BLS payroll data and other labor market indicators since the pandemic began. The ADP reported private payrolls bounced 174k in January, better than expected. The -123k December decline was revised up to a -78k decline. A lot of the bounce was in the service sector where employment increased 156k, with the goods sector adding 19k workers. In the service sector, education/health jobs rose 54k, with a 40k gain in professional/business services, while leisure/hospitality added 35k. Trade/transport employment increased 16k. There was an 18k gain in construction.
We will keep you updated via our Facebook page, YouTube channel and our analysis page where we will have additional live commentary on the results, and market action and reaction.
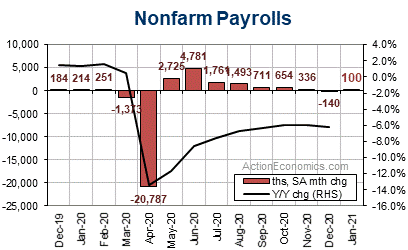
Nonfarm Payrolls meanwhile are expected to show a 100k January bounce with a rebound in most labor market components, as a December jobs mismatch with seasonal patterns is partly reversed. A 0.2% January hours-worked rise is seen with a 34.8 workweek, while the jobless rate has been holding steady from 6.7% since November, and an hourly earnings rise of 0.1% after the 0.8% December pop. The labor market should continue to expand alongside the ongoing climb in output. The report will include benchmark revisions for the establishment survey that will modestly reduce the payroll growth path.
Benchmark Guidance
On August 19, 2020, guidance was released for the expected benchmark revisions to the March ’20 payroll levels that will be revealed in this week’s jobs report. The guidance was for a historically small -173k revision to the March level. The revision implies -14k reductions per month, on average, for the twelve months ending last March. The private payroll figure should be revised down by a larger -229k, with big downward bumps of -125k for professional and business services and -118k for education and health, but a 144k boost for transportation. Total goods sector employment as of March should be trimmed by -90k, or -8k per month, while government employment is boosted by 56k, or 5k per month.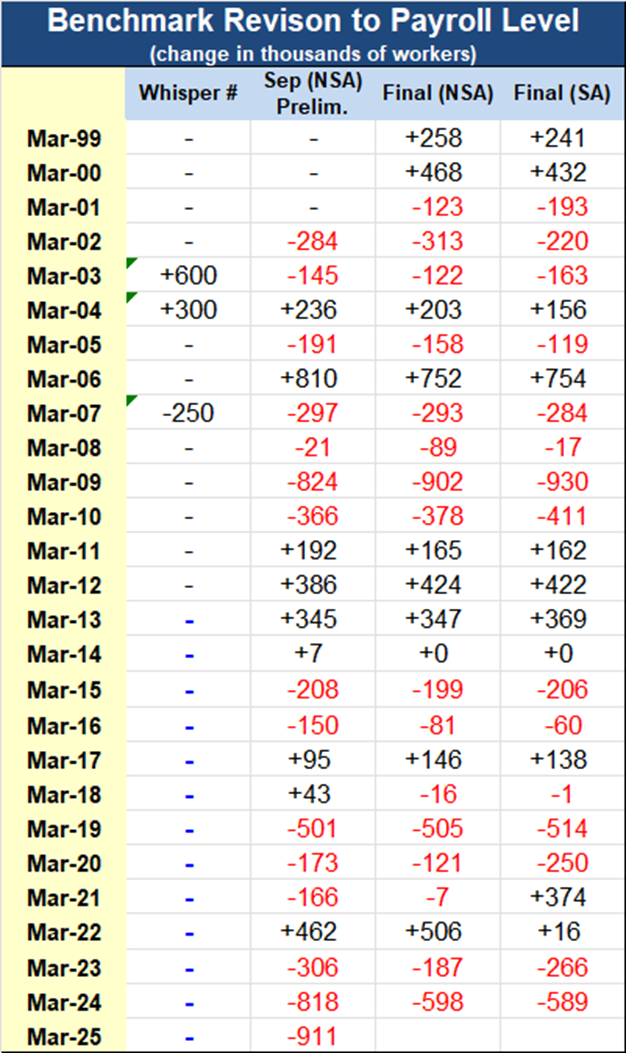 The early guidance is usually quite close to the final result. Last year, guidance of -501k for March ’19 translated to a -505k revision in the NSA level and an SA revision of -514k.
One consequence of the expected annual payroll revisions in early February is that payrolls will show more of a slowing through 2019 into the 2020 downturn, and slightly weaker payroll level at the bottom, before the rebound starting in May. The 178k average payroll gain in 2019 will be lowered, following gains of 193k in 2018 and 176k in 2017. ActionEconomics peg the average payroll drop in 2020 at -624k.
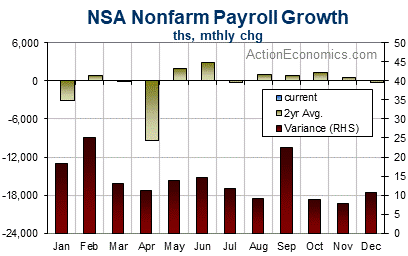
The graph below shows the two-year average NSA payroll change for each month. The seasonal impact through the year on payroll changes is mostly positive, but is negative in December, January and July. Distortions from last year’s COVID-19 hit have produced negative averages for March and April now as well. The NSA average fell to -3,026k in January from -288k in December, 605k in November, and 1,308k in October. The red bars show each month’s variance. After a first-half peak in February, variance decreased over the spring before reaching a second-half peak in September.
For disruptions to employment from weather as gauged in the household survey, the biggest disruptions occur in the winter months generally with the average peak in February. There is an additional climb through the late-summer months due to disruptive hurricanes in some years. The ten-year average number of people not working as a result of weather climbed to 336k in January from 160k in December, 107k in November, 73k in October, and a hurricane boosted this to 184k in September. As usual now, any weather related disruptions will be eclipsed by COVID-19.
The Birth/Death Assumption
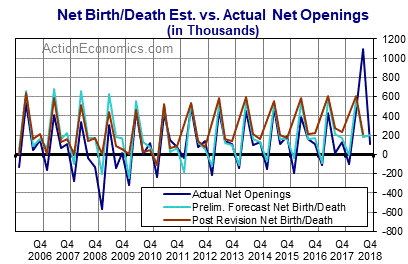
The average net birth/death effect tumbled to -306k in January from -9k in December, -10k in November, and 159k in October. Its 2018 annual high of 260k was in April and its annual low of -198k was in January. After the January low, the month of July marked a summer trough for the average which became more volatile in the second half of the year, oscillating between negative and positive territory with a second half trough in September and a peak in October.
The BLS birth/death assumptions are adjusted each quarter with data from the Quarterly Census of Employment and Wages (QCEW). The QCEW data has been released through 1Q20, and shows a net birth/death effect that was weaker than assumed in the original monthly report. The QCEW data show a -160k net birth effect for 1Q20, compared to the 24k initial assumption.
Hourly Earnings
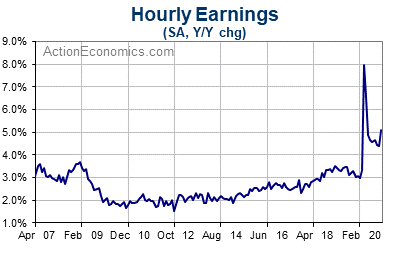
Additionally, average hourly earnings for January is anticipated to rise by 0.1%, after gains of 0.8% in December and 0.3% in November, with swings that likely still largely reflect the percentage of lower paid workers in the jobs pool, as seen with the 4.7% surge last April. We expect a 5.0% y/y increase in January, which is down from 5.1% in December. Growth in hourly earnings was gradually climbing from the 2% trough area between 2010 and 2014 to the 3%+ area until the economy’s plunge last March. As shutdown distortions dissipate, the underlying cyclical uptrend will presumably fall back to the 2%-3% range, though y/y gains will be distorted through 2021 via the comparison effects from year’s Q2 wage spike and ensuing unwind.
The ECI data are designed to avoid distortion from the shift in the composition of jobs that sharply impacted the payroll report’s wage measure. The ECI revealed a 0.7% Q/Q rise in Q4, with a 2.5% y/y gain that exceeded 2.4% in Q3, versus a 1.4% cycle-low in Q4 of 2009. We saw a 2.6% y/y increase for wages and salaries in Q4 after 2.5% in Q3, versus a 1.4% cycle-low in Q4 of 2011. We saw y/y benefit cost growth of 2.3% in Q4, as seen in Q3, versus a 1.5% cycle-low in Q3 and Q4 of 2009.
Click here to access the HotForex Economic Calendar
Andria Pichidi
Market Analyst
Disclaimer: This material is provided as a general marketing communication for information purposes only and does not constitute an independent investment research. Nothing in this communication contains, or should be considered as containing, an investment advice or an investment recommendation or a solicitation for the purpose of buying or selling of any financial instrument. All information provided is gathered from reputable sources and any information containing an indication of past performance is not a guarantee or reliable indicator of future performance. Users acknowledge that any investment in Leveraged Products is characterized by a certain degree of uncertainty and that any investment of this nature involves a high level of risk for which the users are solely responsible and liable. We assume no liability for any loss arising from any investment made based on the information provided in this communication. This communication must not be reproduced or further distributed without our prior written permission.


