


Canada’s GDP grew 9.6% in Q4 (q/q, saar), better than expected after the 40.6% bounce in Q3 (was 40.5%) that followed the 38.5% plunge in Q2. A modest inventory accumulation in Q4 after the huge drawdowns in Q3 added to GDP in Q4. Government consumption, M&E investment and housing investment also made positive contributions. Household spending dipped in Q4. GDP contracted -5.4% in 2020, the largest decline since the series began in 1961. The slip in household spending bodes poorly for Q1, as restrictions likely bit early in the quarter which have left the door open to a small -0.5% decline in Q1 GDP. However, we see activity rebounding 6.5% in Q2, while the recovery extends in the second half amid a stimulative mix of rising vaccination rates, accommodative central bank policy and ongoing support from government stimulus. The separate December GDP tally edged up 0.1% (m/m, sa) after the 0.8% jump (was 0.7%) in November.
The Canadian Dollar as a commodity currency is getting stronger once again despite the Oil near term weakness. USDCAD edged higher following the better than forecast Q4 Canadian GDP, though lighter than expected December GDP data. The pair dipped to 1.2630 from 1.2673 highs overnight, and will now look past the backward looking data, with focus remaining on the risk backdrop, USD direction, and oil prices. Currently risk taking levels are fairly neutral, while the USDIndex remains above Monday’s three-plus week highs. USOIL is above earlier lows, but well off Monday’s peak. As a result, the CAD should remain capped for now.
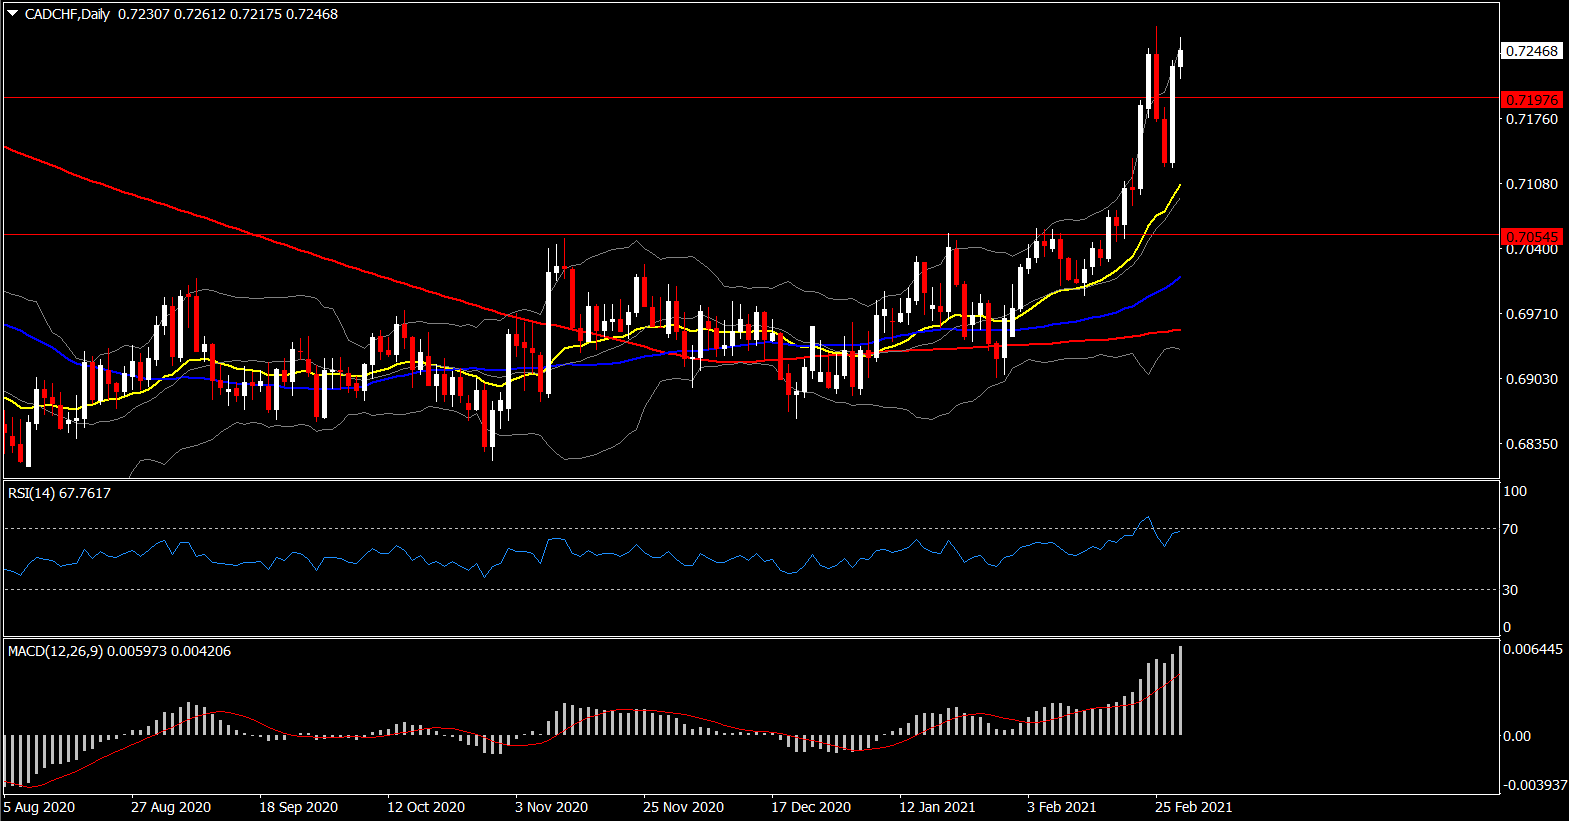
Commodity currencies such as CAD have posted very interesting crosses in the past week, with CADCHF breaking the 61.8% Fib level since 2019’s decline while CADJPY remains for a 3rd week in a row above the 200-week SMA and 2019 highs.
This week CADJPY is retreating the losses from the drift on February’s month end flows to 83.50 from 85.10. The RSI is confirming the recent view and is moving upwards above 60 area with further area to be converted in the positive territory, while the MACD lines are sloping higher suggesting an increasing positive momentum. In trend indicators, the 20-, 50-day and 200-day SMA are endorsing the broader bullish outlook.
In the case that the price remains above the 82.80 support which is set at the 200-week SMA, the price could move until the multi-year Resistance and the round 85.00. Sharper increases could move the market towards the 88.00-88.20 resistance, the highs registered in September-October 2018 and the midpoint of 100% and 161.8% Fib. expansion levels.
Meanwhile, EURJPY has been in a strong upside tendency since October 2020 and if there is a plunge below the uptrend line, that could switch this view to neutral.
Click here to access the our Economic Calendar
Andria Pichidi
Market Analyst
Disclaimer: This material is provided as a general marketing communication for information purposes only and does not constitute an independent investment research. Nothing in this communication contains, or should be considered as containing, an investment advice or an investment recommendation or a solicitation for the purpose of buying or selling of any financial instrument. All information provided is gathered from reputable sources and any information containing an indication of past performance is not a guarantee or reliable indicator of future performance. Users acknowledge that any investment in Leveraged Products is characterized by a certain degree of uncertainty and that any investment of this nature involves a high level of risk for which the users are solely responsible and liable. We assume no liability for any loss arising from any investment made based on the information provided in this communication. This communication must not be reproduced or further distributed without our prior written permission.


