


The Canadian Dollar against the Yen has performed well in the past week and surpassed the 88 level, with a weekly gain of 1.93%. As of the monthly close on March 31, the price of the currency pair rose 5.60% to 88.08.
Last week, the oil market rose instead of falling after OPEC+ announced after its meeting that it will increase production in stages in the next three months; starting in May an additional 350,000 barrels per day will be added to production, with another 350,000 coming on the market in June. Come July output will be increased by 450,000 barrels per day. (Saudi Arabia has voluntarily added an additional 1 million barrels per day to those cuts). The reasons include the loose monetary policy of global central banks, government stimulus measures, and accelerated vaccination programs, which continue to boost market expectations for an early economic recovery. Therefore, market participants believe that oil demand is still expected to record a strong rebound in the second half of this year. The Canadian currency may be boosted as the oil market supply shortage may expand.
In addition, last month the Bank of Canada announced its decision to phase out quantitative easing. According to Vice President Toni Gravelle, Canada will gradually suspend remaining liquidity support projects. Therefore, the Bank of Canada’s balance sheet is expected to fall by 100 billion Canadian dollars to 475 billion Canadian dollars at the end of April. Not only that, Gravelle also said that the central bank will “start raising interest rates after the economy and inflation reach the targets set by the guidelines.” Taking into account the recent good performance of Canadian economic data (helping to shorten the time for the Bank of Canada to start raising interest rates), this is tantamount to a favourable catalyst for the Canadian Dollar bulls.
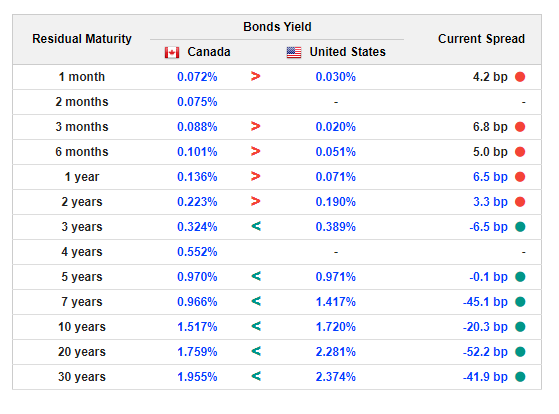
Figure 1: Comparison of Canadian and US multi-year bond yields. Source: ernmentbonds.com/country-comparison/canada-vs-united-states/
From the perspective of bond yields, Canadian interest rates and US interest rates have basically maintained the same direction. Among them, the Canadian 10-year Treasury bond yield reached 1.517%, second only to the United States at 1.720%, and opened a large gap with the interest rates of other countries in the same period. This gap may help the Canadian Dollar perform better than most currencies.
In any case, there are still risks to the outlook for economic growth. The rebound of new virus infections and the high transmission of variant viruses will cast a shadow on the expectation of economic normalization. In addition, Biden’s spending package may also face challenges, which is not conducive to commodity currencies including the Canadian Dollar.
Technical analysis:
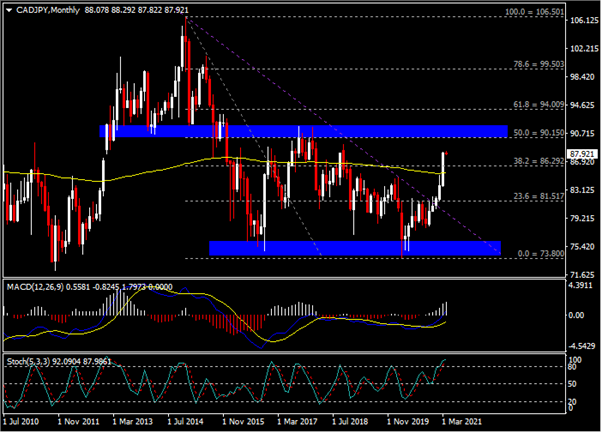
The monthly chart shows that the Canadian Dollar has recorded a 5-month consecutive rise against the Yen and has recently surpassed the previous resistance – 200-day MA (yellow) and 86.30 (the same as the high of 38.2% Fib. level that extended from December 2014 to the low of March last year). From the perspective of technical indicators, MACD turned upward, and its fast line touched the 0 axis; Stochastics was in the overbought area. It is worth noting that the currency pair is trading above the 200-day SMA in the short-term (M30, H1, H4) and even the medium- and long-term (D1, W1, MN), indicating a relatively strong upward trend.
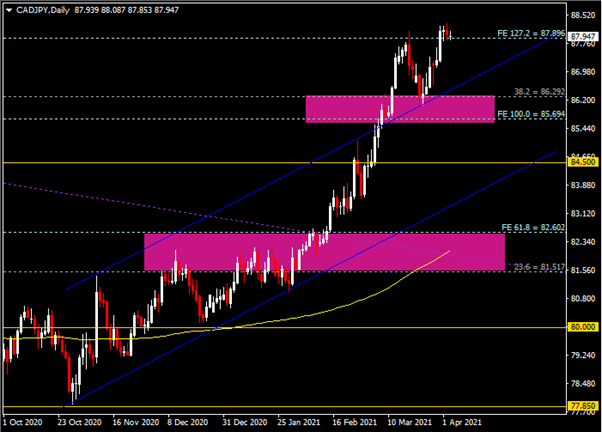
The daily chart shows that the currency pair is testing the 127.2% Fibonacci extension level (87.90) seen on the weekly chart. Should the breakthrough succeed, it could breach the key resistance from September 2018 that saw highs of 87.85 and 90.15 (the same as the weekly 50.0% Fib. level) to 90.70 (the same as the daily FE161.8%). However, should the exchange rate have a correction, the key near-term support is seen in the lower channel trend line and the 85.70 to 86.30 area.
Click here to access our Economic Calendar
Larince Zhang
Market Analyst – HF Educational Office
Disclaimer: This material is provided as a general marketing communication for information purposes only and does not constitute an independent investment research. Nothing in this communication contains, or should be considered as containing, an investment advice or an investment recommendation or a solicitation for the purpose of buying or selling of any financial instrument. All information provided is gathered from reputable sources and any information containing an indication of past performance is not a guarantee or reliable indicator of future performance. Users acknowledge that any investment in Leveraged Products is characterized by a certain degree of uncertainty and that any investment of this nature involves a high level of risk for which the users are solely responsible and liable. We assume no liability for any loss arising from any investment made based on the information provided in this communication. This communication must not be reproduced or further distributed without our prior written permission.


