


Today, May 10, Marriott International – the largest US hospitality company, headquartered in Bethesda, Maryland, USA – is to announce its first quarterly report for 2021.
According to Zack’s investment research and based on nine analytical forecasts, the estimate consensus of earnings per share for the quarter is $0.03, while earnings per share for the same quarter of last year was $0.26.
Over the past two years, Marriott has achieved a victory in the earnings per share estimate 50% of the time, and also overturned revenue 25% of the time. In the past three months it has achieved four bullish reviews and 12 bearish reviews on the side. The preceding nine months of the past year saw no revenue assessment nor upward revision, but saw a decline in eight.
Technical analysis of Marriott International:
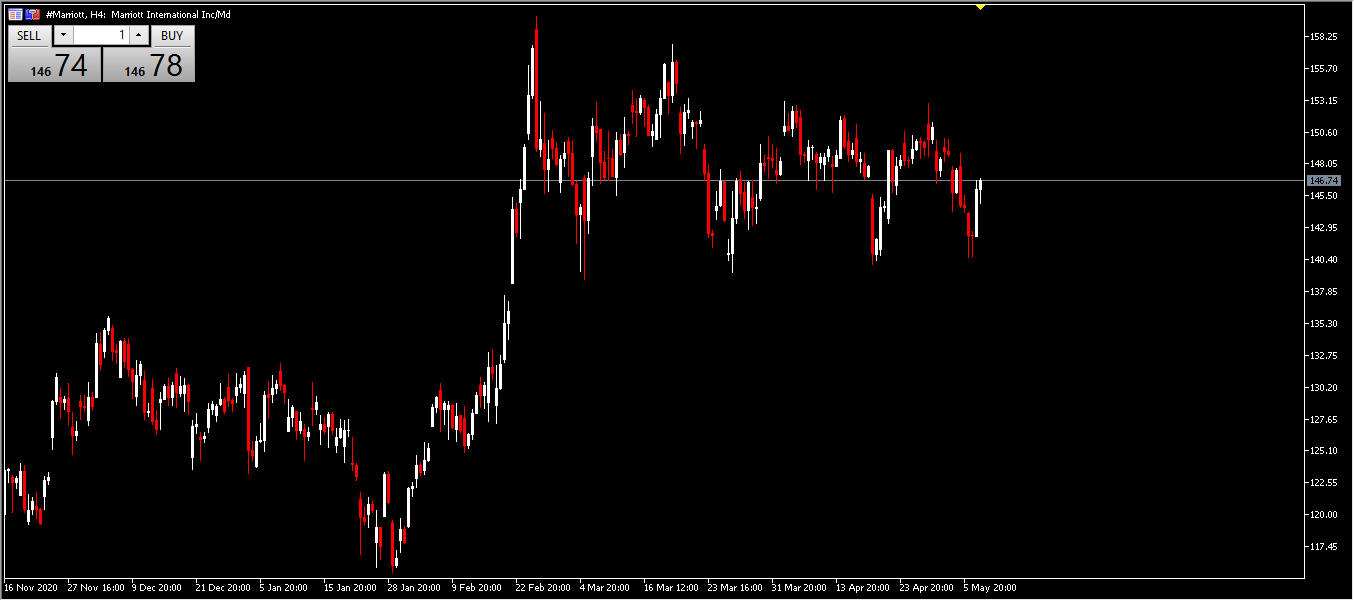
As shown by the above chart of the Marriott International stock price, on a four-hour timeframe, the price has risen tremendously since the beginning of 2021, from $115.90 per share to nearly $158.72 per share. Then it started moving in a sideways channel around $146.74 which was support and turned into resistance.
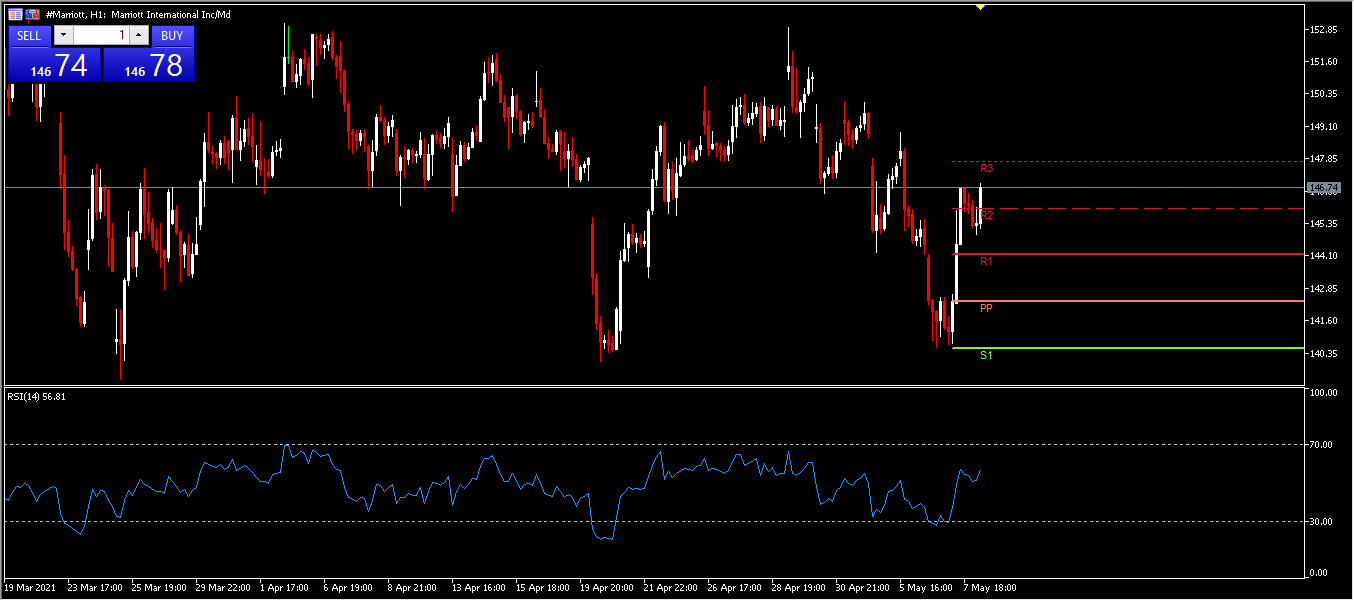
Many traders use the Relative Strength Index (RSI) to help make an appropriate decision: Should one continue or exit the trade? As shown in the previous figure for the share price on an hourly timeframe, the index was on the rise on May 7 until it reached 56.81.
The chart shows us the axes, resistance and support lines, and the main axis appears at approximately $142.00; resistance 1 is at $144.10, resistance 2 is at approximately $146.00, resistance 3 is at $147.85, while the support stands above $140.35.
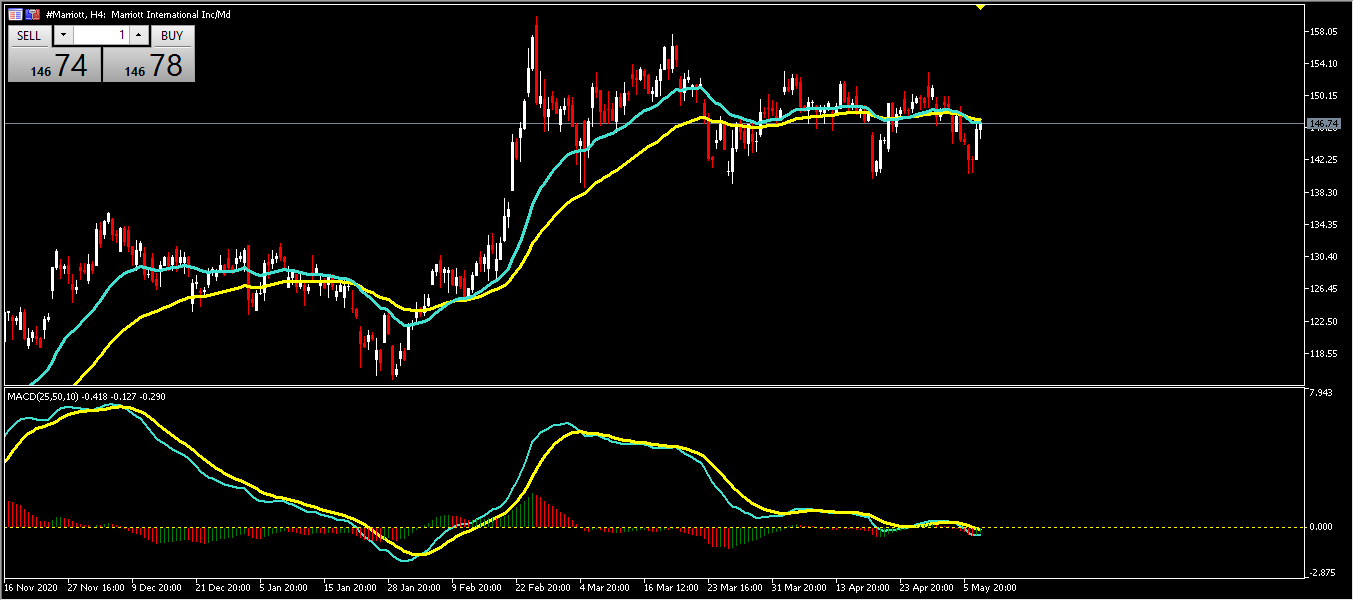
The above chart indicates the movement of the stock price on the four-hour time frame of the green moving average lines of 25 and the yellow moving average 50, and that SMA 50 has broken and surpassed the moving average 20 at the beginning of last February, when the two lines began to converge. However, the MACD on the downside shows a slight increase in the 25-day moving average from the 50-day moving average.
Click here to access our Economic Calendar
Eslam Salman
Regional Market Analyst – Middle East
Disclaimer: This material is provided as a general marketing communication for information purposes only and does not constitute an independent investment research. Nothing in this communication contains, or should be considered as containing, an investment advice or an investment recommendation or a solicitation for the purpose of buying or selling of any financial instrument. All information provided is gathered from reputable sources and any information containing an indication of past performance is not a guarantee or reliable indicator of future performance. Users acknowledge that any investment in Leveraged Products is characterized by a certain degree of uncertainty and that any investment of this nature involves a high level of risk for which the users are solely responsible and liable. We assume no liability for any loss arising from any investment made based on the information provided in this communication. This communication must not be reproduced or further distributed without our prior written permission.


