USDRUB, H4 & Daily
The Kremlin has confirmed that the Putin-Biden summit will kick off in Geneva, Switzerland at 11 am GMT on June 16. The agenda includes nuclear stability, climate change, and cyber security. Earlier, the Kremlin staff stated that the leaders of the two countries are “unlikely to reach an agreement, but they still maintain a pragmatic optimism about this meeting”.
That the relationship between the United States and Russia has fallen to freezing point, is well known. In addition to the verbal testing of each other, the two countries are also competing in other areas such as military and finance. Just yesterday (June 14), a new round of US sanctions against Russia came into effect. The specific content includes prohibiting US companies from buying Russian government bonds in the primary market and Russian government bonds denominated in Euros. Considering that the secondary market has not been affected, this sanction measure is more like a warning issued by the United States to Russia following a series of actions by the latter (1, 2).
As the United States gradually tightened its sanctions against Russia, the latter had begun planning to “de-dollarize” earlier. Not only the Central Bank of Russia, but also the country’s Finance Minister Anton Siluanov recently stated that “the US dollar assets will be completely removed from the National Wealth Fund within the next month ” [ data shows that as of March this year, Russian holdings of US Treasury bonds are as high as 3.976 billion US dollars].
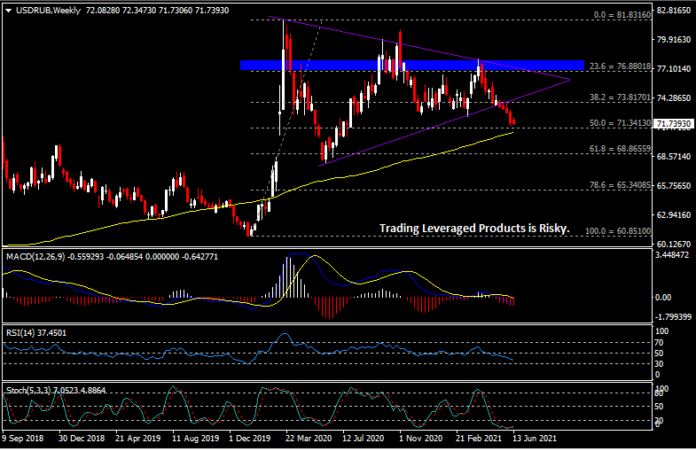
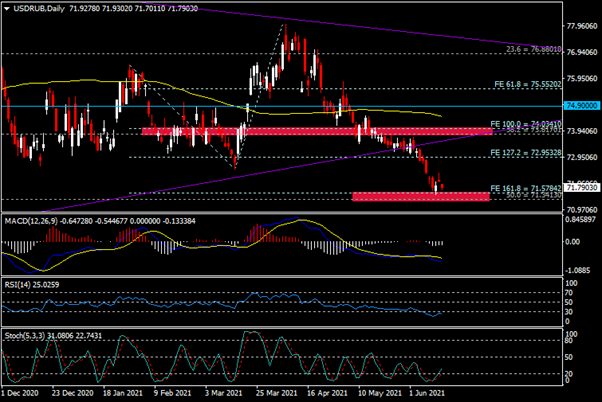
The daily chart shows that after the financial sanctions took effect, the US Dollar opened higher (highest 72.3475) and then declined (lowest 72.0180) against the Ruble to close at 72.040. Today, the USDRUB currency pair continues to be in the doldrums (opened low and going lower). At the time of writing, it is at 71.7903. In the short term, the pair is still in a downward trend, while in the daily, H4 and intra day charts are all under pressure and below the 100-day simple moving average. However, the weekly chart shows that the moving average is located in the region of 71.3415 to 71.5787 (corresponding to the 50.0% Fibonacci retracement level from the low in January last year to the high in mid-March,and the 161.8% Fibonacci extension on the daily chart.). This area plus the moving average forms a strong support. If the downside breakout is successful, the currency pair will have the opportunity to test the second support 70.0605 (200.0% Fibonacci extension level), the psychological level 70.0000 and the third support at 68.8655.
In any case, considering that the oscillator indicators on the weekly and daily charts are approaching or are already in the oversold area (Stochastics has formed a golden cross), the short-term downward momentum of the exchange rate may be hindered. Recent resistance zone runs from 72.5013 up to 72.9530 (Fibonacci 127.2% Fibonacci extension level) area.
Click here to access our Economic Calendar
Larince Zhang
Regional Market Analyst
Disclaimer: This material is provided as a general marketing communication for information purposes only and does not constitute an independent investment research. Nothing in this communication contains, or should be considered as containing, an investment advice or an investment recommendation or a solicitation for the purpose of buying or selling of any financial instrument. All information provided is gathered from reputable sources and any information containing an indication of past performance is not a guarantee or reliable indicator of future performance. Users acknowledge that any investment in Leveraged Products is characterized by a certain degree of uncertainty and that any investment of this nature involves a high level of risk for which the users are solely responsible and liable. We assume no liability for any loss arising from any investment made based on the information provided in this communication. This communication must not be reproduced or further distributed without our prior written permission.


