


The electric vehicle giant – Tesla (#Tesla) is set to release its third quarter earnings in 2021 on the 20th October (Wednesday) after market close.
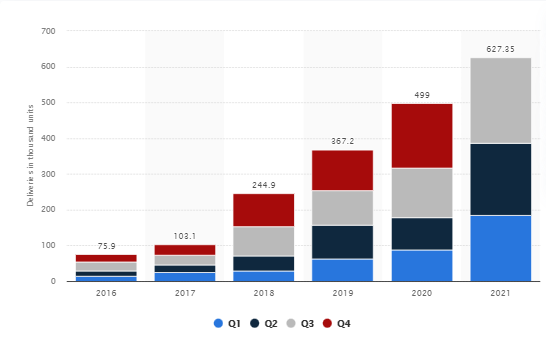
Figure 1: Number of Tesla Vehicles Delivered Worldwide. Source: https://www.statista.com/statistics/502208/tesla-quarterly-vehicle-deliveries/.
In Q2 2021, supply chain challenges did not halt Tesla from breaking records, for example over $1B of GAAP net income and 11.0% of operating margin (was only 5.4% from the same period in the year prior) for the first time. Other achievements include revenues and adjusted EPS beating consensus estimates, stood at $11.96B (up 15% (q/q) and 98% (y/y)) and $1.45 (up 56% (q/q) and 230% (y/y) respectively. These successes came along with the company’s ability in expanding production despite continuous semiconductor shortages while meeting increasing market demand.
Following the company’s recent announcement, the number of vehicles delivered worldwide in Q3 hit over 240K units (96.16% of deliveries (or 232,025) are contributed by Model 3/Y, beating Zacks Consensus Estimates by 5.87%), up nearly 20% (m/m) from the previous quarter and about 73% (y/y) from year-ago period. The tremendous result has exceeded CleanTechnica’s expectation (241,300 versus 240,000). This has also resulted in the total vehicles delivered surpassing its highest record as seen in 2020 (just merely under 500K) to 627,350 vehicles (will it hit 1M vehicles by the end of 2021?).
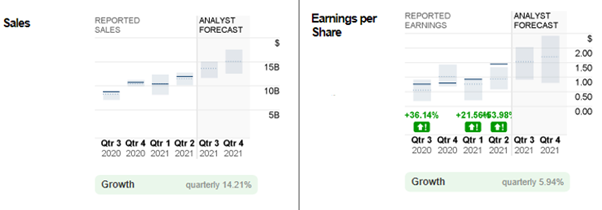
Figure 2: Tesla’s Quarterly Reported Sales and Earnings per Share. Source: https://money.cnn.com/quote/forecast/forecast.html?symb=TSLA.
Consensus estimates for Tesla’s upcoming earnings announcement remain in an upbeat tone. The Wall Street analysts believed that robust delivery numbers and higher vehicle pricing could serve as positive catalysts for Tesla, while offsetting additional costs raised from supply chain challenges. Thus, it is widely expected for sales to hit $13.7B, up slightly more than 14% (q/q) and 55% (y/y) respectively. As for earnings per share (EPS), analysts’ estimation stood at $1.54, up over 6% (q/q) and 102% (y/y).
In general, as long as the company keeps its pace of growth by ensuring equipment capacity and operational efficiency works at an optimum level to meet sustained demand, while at the same time coping well with supply chain issues (in which the shortages may be likely to respite only by 2023), upside potential exists. However, on the downside, factors to be considered involve increasing competition especially in the US (Ford Motor), Europe (Volkswagen AG) and China (NIO), which may eventually reduce Tesla’s market share in these regions, as well as ongoing quality concerns and safety issues that may deteriorate consumers’ demand for its vehicles. Also, recent data shows major economy China hit its slowest growth pace in the year, with its Q3 GDP expanded only 4.9%, well below consensus estimates 5.2% and those in Q2 7.9% as a consequence of crises in energy, shipping and real estates, which may also develop as risk of contagion (or domino effect) for individual sector and later, the broader economies and financial markets.
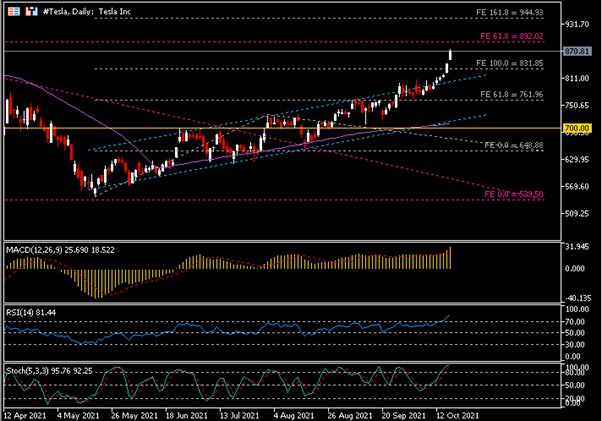
The Daily chart displays #Tesla share price remains solid in the latter half of 2021. Following its rebound from the lows $546.87 in mid-May, it is seen traded within an ascending channel until it broke and closed above the upper channel line last week. As of yesterday’s close, the company’s share price has accumulated gains nearly 60%.
On the other hand, indicators are positively configured: MACD fast and slow lines formed a golden cross above 0 line and pointed towards north, while RSI and Stochastics Oscillators hovered in overbought zone. $890 – $900 (Jan 2021 highs) is the nearest resistance zone to watch. A successful breakout above this zone may possibly open up opportunities for #Tesla share price to extend its gains towards $945 and $1015. Otherwise, $830 serves as the nearest support. Together with the upper line of ascending channel, they form a solid support zone. Thus, a strong bearish candlestick close below this zone may indicate weakness of the price, towards the next target at $760 – $764 (median estimate of analysts) and $700.
Click here to view the economic calendar
Larince Zhang
Market Analyst
Disclaimer: This material is provided as a general marketing communication for information purposes only and does not constitute an independent investment research. Nothing in this communication contains, or should be considered as containing, an investment advice or an investment recommendation or a solicitation for the purpose of buying or selling of any financial instrument. All information provided is gathered from reputable sources and any information containing an indication of past performance is not a guarantee or reliable indicator of future performance. Users acknowledge that any investment in Leveraged Products is characterized by a certain degree of uncertainty and that any investment of this nature involves a high level of risk for which the users are solely responsible and liable. We assume no liability for any loss arising from any investment made based on the information provided in this communication. This communication must not be reproduced or further distributed without our prior written permission.


