


ExxonMobil
ExxonMobil is an American multinational oil and gas company headquartered in Irving, Texas. ExxonMobil was founded in 1999 after the merger of Exxon Corporation (which was called Standard Oil of New Jersey) with Mobil Corporation (which was called Standard Oil of New York State). The company has multiple sub-brands, namely, ISO, ExxonMobil Chemical, Mobil, and Exxon.
The company fell seven places and became the 10th on the Fortune 500 list due to the global shutdown that cut energy demand in 2020. It reported an annual loss of $22 billion in 2020, the largest loss the company has ever incurred, and there was also a huge rise in debt.
The company’s second-quarter 2021 profits came in at $4.7 billion, or $1.10 per share, compared to a loss of $1.1 billion in the second quarter of 2020. This increase in profits was due to increased demand for natural gas and oil and better quarterly contributions in Lubricants and chemicals. $9.7 billion in cash flow from operating activities funded debt reduction, capital investments, and dividends.
In July 2021, the company signed memoranda to explore the development of CO2 infrastructure in France and to participate in the Carbon Capture and Storage (CCS) project in Scotland. The collaboration in the Normandy region of France seeks to develop CCS technology with the goal of reducing CO2 emissions by up to 3 million metric tons per year by 2030. The Acorn CCS project in Scotland plans to capture and store approximately 5 million to 6 million metric tons of CO2 per year by 2030.
Technical Analysis
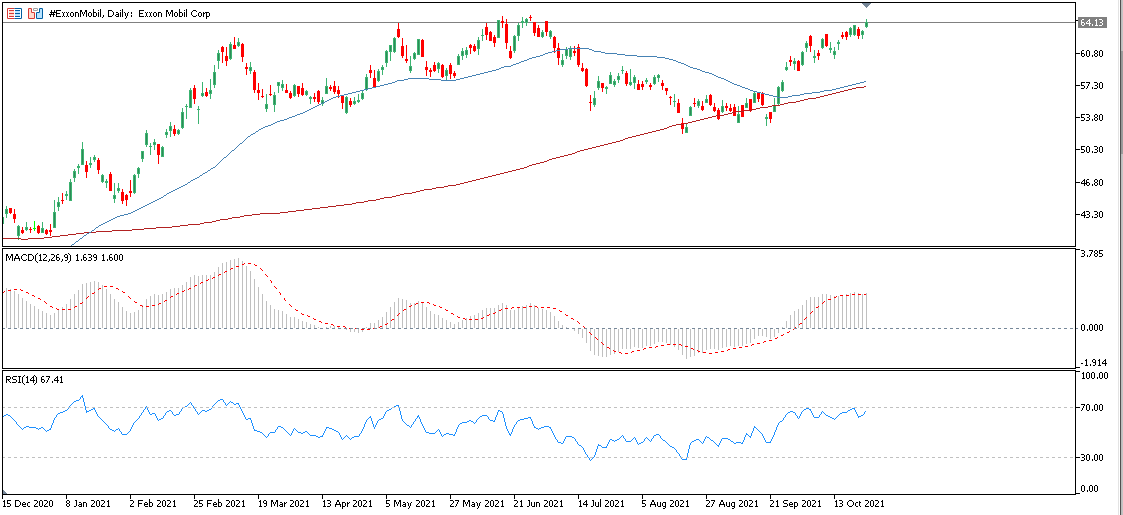
On the daily time frame, the 50 SMA (blue) is above the 200 SMA (red) and this confirms the continuation of the bullish trend. The upward trend continues from October 29, 2020 until now. The highest peak reached was at 64.92 and the lowest support at 31.09. It is now trading at 64.13.
Meanwhile the MACD signal line and histogram are above the 0 line and continue to rise, and RSI (14) is at 67.41 and refers to the top which shows the rise.
Here in the following chart, we find the main pivot and the levels of support and resistance, and we find them converging to each other, so the main pivot appears at 62.92. There are three resistances: the first resistance at 63.49, the second resistance at 63.75, and the third resistance at 64.32. There are three supports and they are: the first support at 62.62, the second support at 62.00 and the third support at 61.70.

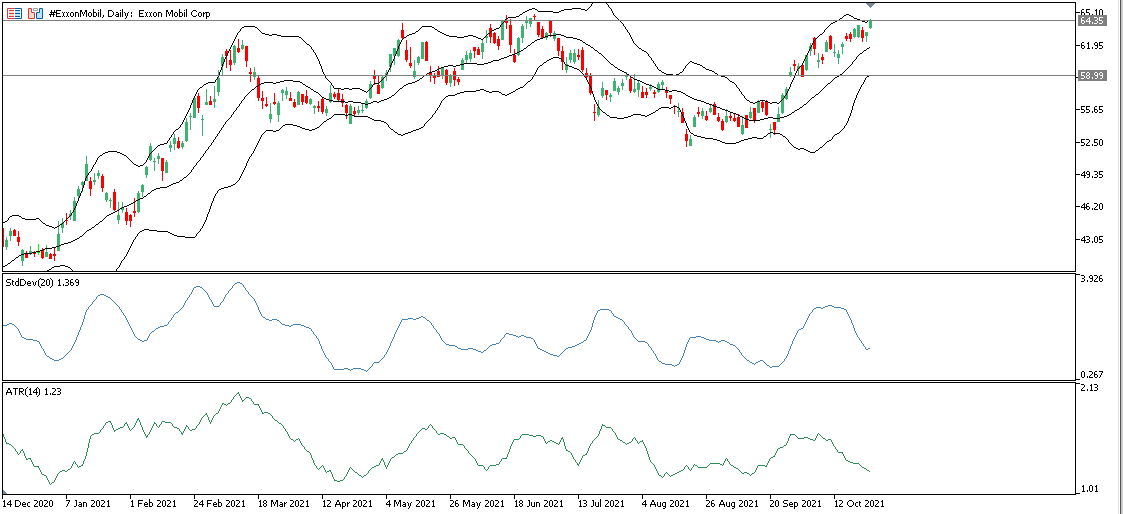
As for the Bollinger bands, the upper band of the volatility channel is at 64.35 while the downside comes in at 58.99 (20-day SMA at 61.70). We notice here that the upper, middle and lower bands are approaching each other, and this indicates a period of low volatility. We also find the Standard Deviation Index (20) at 1.369 in the oversold area, while the Average True Range (14) is at a value of 1.23. Hence the asset is showing an intraday increasing positive bias before the earnings release, with major support at 53.71. The medium-term outlook remains positive as the asset is flat at 4-month highs with a bullish crossover from the 20- and 50-day simple moving averages and rising MACD lines suggesting that the bulls are still in control. A break below 53.71 could open the door to 52.13 (August low), while a further rise above 64.14 could draw attention to the 70 area.
Click here to access Hot Forex’s economic calendar
Islam Salman
Market Analyst – Middle East
Disclaimer: This material is provided as a general marketing communication for information purposes only and does not constitute an independent investment research. Nothing in this communication contains, or should be considered as containing, an investment advice or an investment recommendation or a solicitation for the purpose of buying or selling of any financial instrument. All information provided is gathered from reputable sources and any information containing an indication of past performance is not a guarantee or reliable indicator of future performance. Users acknowledge that any investment in Leveraged Products is characterized by a certain degree of uncertainty and that any investment of this nature involves a high level of risk for which the users are solely responsible and liable. We assume no liability for any loss arising from any investment made based on the information provided in this communication. This communication must not be reproduced or further distributed without our prior written permission.


