Pricing on Fed and BOE rate hikes dimmed for a while and pushed gold prices higher above $1800 in last week’s trade, with a weekly gain of 1.9% and capped at $1818.05. Although US economic data is very solid and supports the strengthening the US Dollar and stock prices continue to soar, the story behind the strengthening of precious metals last week is the falling global bond yields.
The disruptions of the global supply chains are not new, however the time indications suggest this will last for a while as the immediate effects across the supply chain continue to creep in without pause. This week, all eyes will be on price pressures in inflation data. Central Bank officials agreed that inflation is temporary, and that medium term inflation expectations are still too low, but said that current price increases will eventually moderate, in an attempt to calm the market. However, markets have reacted well in advance that price levels will unlikely be completed overnight, on the basis of consideration of supply chain and distribution bottlenecks, and the energy crisis and labour shortages have been the main reasons for inflation to simmer for longer amid rising demand.
US CPI growth is expected to remain high, up nearly 6% compared to October 2020 as consumer price growth continues to be affected by last year’s low prices. The BoC acknowledged more persistent price pressures and forecast inflation averaging 4.8% in Q4, before dropping to an average of 3.4% next year. In Asia, China’s economy slowed, while manufacturing and non-manufacturing PMI weakened in October. Energy shortages, ongoing COVID disruptions and supply chain disruptions suggest Q4’s economic performance got off to a difficult start and could remain under pressure.
Gold strengthened despite higher interest rates and equity strength.
Gold rose 1.5% in October testing the $1,800 level several times later in the month. Gold’s positive return in October marked a reversal of weaker performance in the previous two months. This performance is consistent with historical analysis showing that gold performed well in early autumn. The strength of gold prices comes amid higher nominal yields: gold has generally correlated inversely with nominal bond yields this year. However, the increase in inflation expectations exceeds the movement of the nominal rate and results in a lower real rate. In addition, risk-on sentiment did not limit the strength of gold prices, as many stock indexes closed at all-time highs with the US and Europe up 5-8% across major markets, while Asian markets were relatively flat to slightly lower, especially with weak Chinese economic data released throughout the month. Some central banks are starting to raise interest rates or reduce asset purchases and investors are starting to focus on flattening the interest rate curve and its potential implications if the trend continues.
Commodities were stronger in October: gold +1.5%, silver gained +7.7%, palladium +5.5%, platinum +6.2%, copper +3.8% and oil rose above 10%. While the cotton agricultural sector rose +8.6% into winter, coffee is still +5.1% at an annual peak, sugar corrected -4.9% in the buying trend path, while chocolate suffered a sharp decline of -3.5% in October followed by a continued decline at the beginning of November by -5.7%. Individual commodity supply constraints remain the focus of investors, which is a meaningful driver for current performance.
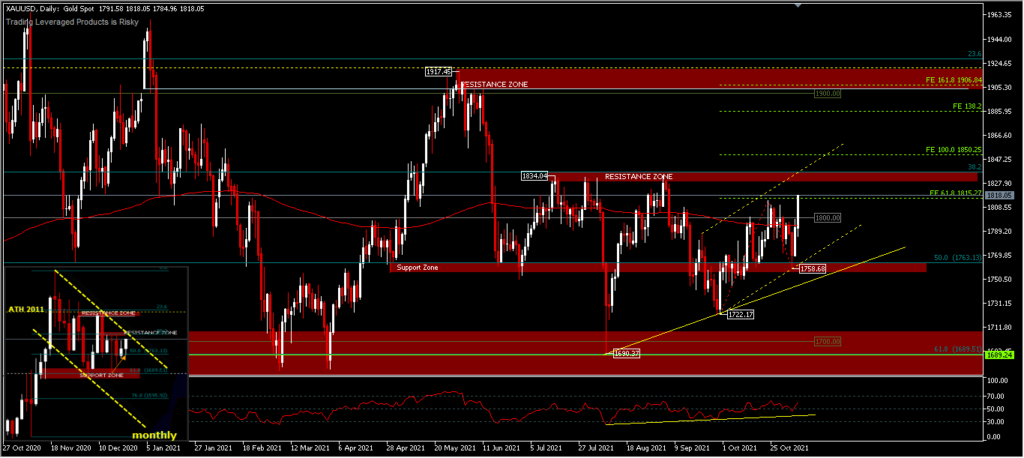
XAUUSD, D1
XAUUSD,D1 – From a technical analysis perspective, $1,800 has been a crucial resistance level and will still be a guide, if it turns out that the asset price is pulled back to the downside below that level. Asset prices have struggled to hold above the 200-day EMA, which is currently just below the $1,800 level. A further rally is expected towards the resistance zone of $1,834 which is an important structural resistance. A breakout of this level would confirm that the continued decline of $1,917.45 has ended at $1,690.37 and the price will move higher than the current level, towards the FE100 projection at $1,850 and resume to FE161.8 around $1,900. As long as the resistance of $1,834.04 persists, the price bias tends to consolidate before determining the next direction. Overall, the XAUUSD price map is in the range of 1700-1800-1900 throughout 2021 which is a large range for annual consolidation.
Click here to access our Economic Calendar
Ady Phangestu
Market Analyst – HF Educational office – Indonesia
Disclaimer: This material is provided as a general marketing communication for information purposes only and does not constitute an independent investment research. Nothing in this communication contains, or should be considered as containing, an investment advice or an investment recommendation or a solicitation for the purpose of buying or selling of any financial instrument. All information provided is gathered from reputable sources and any information containing an indication of past performance is not a guarantee or reliable indicator of future performance. Users acknowledge that any investment in Leveraged Products is characterized by a certain degree of uncertainty and that any investment of this nature involves a high level of risk for which the users are solely responsible and liable. We assume no liability for any loss arising from any investment made based on the information provided in this communication. This communication must not be reproduced or further distributed without our prior written permission.


