


The weakening of the global stock market last week, the sharp decline in global bond yields, the hot ball of inflation and fears of a new virus variant continue to color the fluctuations in metal commodity prices. The new virus variant and increasing cases in Europe could lead to new lockdowns and travel restrictions that will further weaken global economic activity and demand for industrial metals.
Last week’s spot gold price closed lower at $1,788.10 after the previous week’s high of $1,877.15. The metal has fallen about 6% to $1,788.10 in 2021. Inflation, however, has gone the other way with the US consumer price index (CPI) showing prices jumped 6.2% in October from a year earlier, marking the fastest rise in consumer prices in the last 30 years. The price of gold has recently been affected mainly by two fields, i.e. the inflation rate and the prospect of a rate hike, thus making it less bright in 2021.
The price of this asset formed 3 days of directionless trading last week in conjunction with the Thanksgiving holiday, so it is important to pay attention to the actual price direction of any price changes on Monday. If the risk-off mood continues and lacks liquidity and transaction volume, it may lead to the $1,750.00 level.
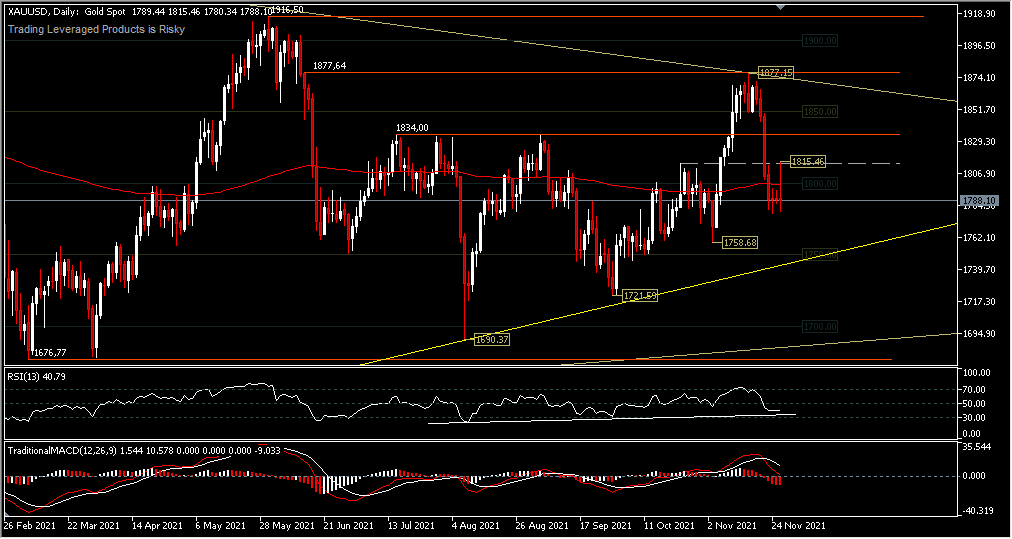
The signal that supports the rise in asset prices will be a test of the trend line on the RSI or a rebound from the lower border of the triangle pattern around the support at $1,750.00-$1,758.58. If this scenario fails, the asset price could fall further, while a break of the $1,750.00 price level could extend the correction to the support level of $1,721.59 and the year’s low of $1,676.77. On the upside, asset prices should sit back above the $1,834.00 resistance to confirm value growth. However, the price of $1,800.00 will temporarily become a dynamic resistance, where we can see the 200-day exponential moving average stretch at this price level.
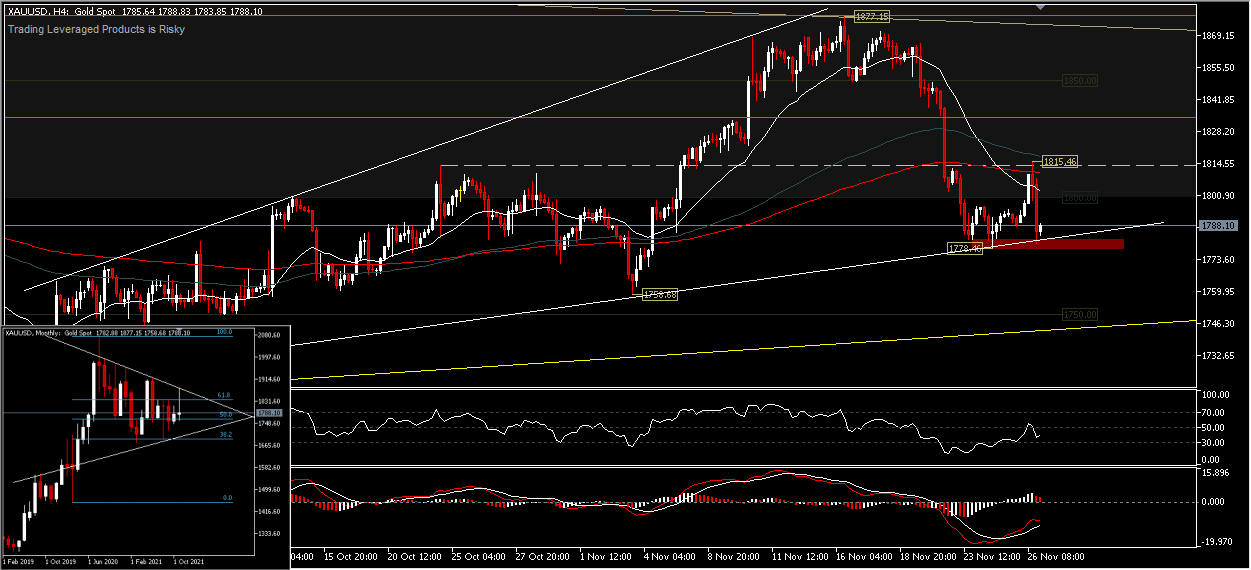
XAUUSD,H4 – Temporary intraday bias looks neutral below the round number $1,800.00 level but selling pressure cannot be ignored, especially since the price is below the 200-period SMA. If finally there is a break of the ascending trendline (white line) and minor support $1,778.46 it could trigger some selling pressure for a lower price direction at $1,758.58 and $1,750.00. As long as the support at $1,750.00 or the lower trendline (yellow line) of the triangle pattern holds, it is likely that we will see some price fluctuations continue this week. On the upside, there will be a test of the $1,800.00 round number and $1,815.46 minor resistance before being able to retest the $1,834.00 resistance level and the recent peak.
Overall, asset prices tend to be more in the direction of confirmed consolidation of the transaction data in the form of a slim monthly body candle.
Click here to access our Economic Calendar
Ady Phangestu
Market Analyst – HF Educational office – Indonesia
Disclaimer: This material is provided as a general marketing communication for information purposes only and does not constitute an independent investment research. Nothing in this communication contains, or should be considered as containing, an investment advice or an investment recommendation or a solicitation for the purpose of buying or selling of any financial instrument. All information provided is gathered from reputable sources and any information containing an indication of past performance is not a guarantee or reliable indicator of future performance. Users acknowledge that any investment in Leveraged Products is characterized by a certain degree of uncertainty and that any investment of this nature involves a high level of risk for which the users are solely responsible and liable. We assume no liability for any loss arising from any investment made based on the information provided in this communication. This communication must not be reproduced or further distributed without our prior written permission.


