


BTCUSD, Daily
After Bitcoin’s price fell from the all-time high seen in November in the $69,000 zone , traders and investors are now expecting a bounce from the 45,000 support level, a three-month low that has accompanied the trend of the bullish divergence seen in the Day timeframe. However, as long as the price is unable to rise above the MA200, it is likely to continue its decline.
The move to a new all-time high in 2021 has to be acknowledged in part due to the oversupply of liquidity driven by government and central bank stimulus policies, which this year may be different as banks will have to return to normal policies to cope with continued high inflation. In addition to this, in 2021 there were a number of important events that boosted the price of Bitcoin.
- In February, Tesla invested $1.5 billion in Bitcoin along with an announcement of accepting payments with Bitcoin, but later Tesla announced that the idea was abandoned.
- In April, Coinbase floated on the stock exchange and as a result, the price of Bitcoin rose above $60,000 for the first time.
- In October, the first Bitcoin ETF was launched that can be traded on the US market, the ProShares Bitcoin Strategy Fund (BITO). Bitcoin made a new all-time high in November in the $69,000 zone.
For 2022, the arrival of Metaverse means more trading and investment options. Coupled with the reduction of government and central bank stimulus measures, that means the market capitalization is declining. While investment options on Blockchain products are on the rise, this could result in bitcoin prices in 2022 not being so bright.
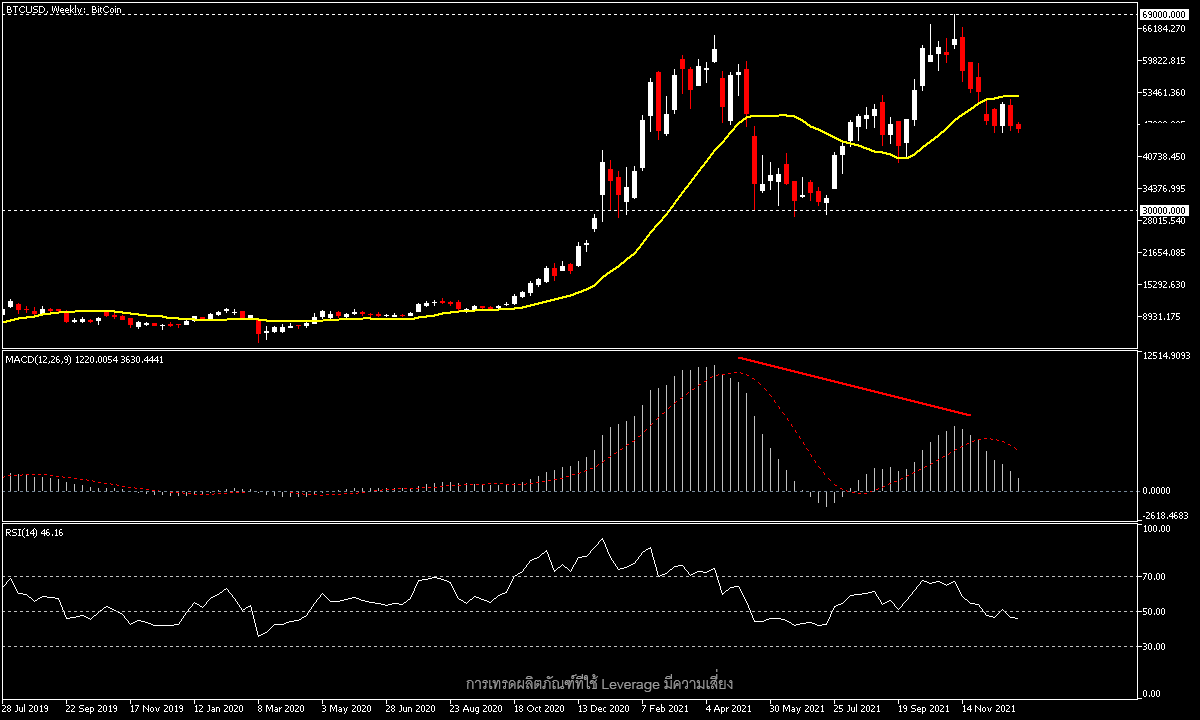
BTCUSD – Bearish Divergence seen in Weekly Timeframe
From such trends it can be seen from a technical perspective in the weekly timeframe that a bearish divergence (different from what is seen in the daily timeframe) is visible and the price is below the MA20 line, entering its fifth week, while the MACD is falling near the 0 line and the RSI is at 46. If the price breaks 45,000, there will be first support at the September low at 40,000, while on an uptrend there will be first resistance at the 52,000 zone.
Click here to access our Economic Calendar
Chayut Vachirathanakit
Market Analyst – HF Educational Office – Thailand
Disclaimer: This material is provided as a general marketing communication for information purposes only and does not constitute an independent investment research. Nothing in this communication contains, or should be considered as containing, an investment advice or an investment recommendation or a solicitation for the purpose of buying or selling of any financial instrument. All information provided is gathered from reputable sources and any information containing an indication of past performance is not a guarantee or reliable indicator of future performance. Users acknowledge that any investment in Leveraged Products is characterized by a certain degree of uncertainty and that any investment of this nature involves a high level of risk for which the users are solely responsible and liable. We assume no liability for any loss arising from any investment made based on the information provided in this communication. This communication must not be reproduced or further distributed without our written permission.


