


It is earnings season once again and the US investment bank giants are scheduled to be the first to release their Q4 2021 financial results. The overall outlook for the US banking sector remains strong, with economic recovery moving at a healthy pace, and the expectations for tighter monetary policy going into 2022 – markets are pricing in around 3 rate hikes by the Federal Reserve – will allow banks to increase their net interest margin on loans, which is also positive. However, higher interest rates might not be good news for the stock markets in general and the anticipated flattening of the yield curve could also be a cause for worry especially in the short term, not to mention the rising virus cases around the world which if not gotten under control could result in further restrictions and slowdown in the economic recovery.
Goldman Sachs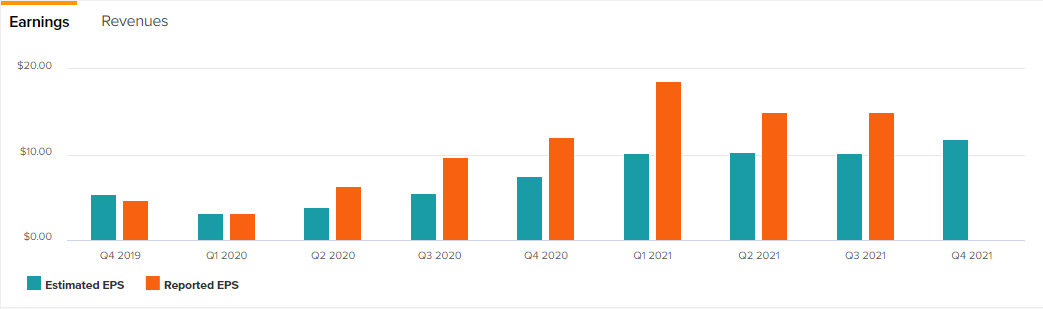
Source: Tip Ranks
Goldman Sachs is expected to report its earnings and revenue result for Q4 2021 on the 18th of January before market open. Analysts at Zacks projects quarterly earnings to come in at $12.10/share up 0.17% from $12.08/share a year ago and estimates revenue to print at $12.09 billion, up 3% from $11.74 billion in the same quarter in 2020, along with a solid bounce in the full year earnings to $60.70, significantly up from $24.74 EPS in 2020. Following the optimistic outlook as highlighted by Chairman and CEO, David Solomon, after the two strategic acquisitions which he said will enhance the scale and ability of the bank to drive higher and more durable returns, the bank’s expansion plans in Latin America and the $1.7 billion in share repurchases, not forgetting that GS has beat market estimates in 4 of the last 4 quarters by an average of 59.4%; we can expect another solid print this quarter.
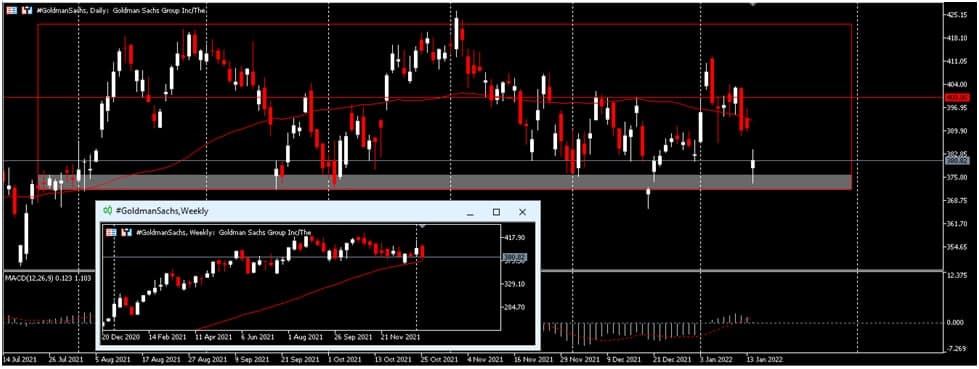 #GoldmanSachs Daily
Since mid-2021, the #GoldmanSachs share price has stalled within a range between $370 and $420, keeping a wide swing within the area. Although this comes after a monstrous rally of about 230% from the lows of the pandemic in March 2020 around $130, and despite due some correction, the solid fundamentals of the company have kept the price afloat. It is currently trading at the lower end of the range around $380; there is more room to the upside if we see another solid financial report with the 50-day moving average standing as the first resistance, followed by the $400 level and then the top of the range. The MACD adds to the positives and the weekly chart still shows a solid bullish trend.
Bank of America
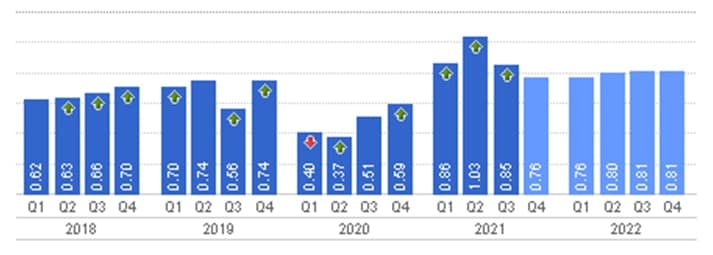 Earnings History and Projections
Source: CNBC
The second largest banking institution in the US is expected to report its financial results for Q4 2021 on the 19th of January, before market open. According to Zacks, consensus estimates holds EPS at 76 cents per share on revenue of $22.08 billion which represents an increase of 21.81% and 9.88% respectively from the same period last year. Despite failing to beat earnings estimate only once since Q1, 2018 with the latest print beating by 66.67%, Zacks’ earnings ESP holds negative at -0.66% showing that recent information has seen analysts revise estimates downward, earning it a #3 (hold) rating on Zack’s rank. However, there is cause for optimism as the bank, in the previous quarter, posted a revenue -net of interest paid – of $22.8 billion (12% growth), returned nearly $12 billion to shareholders and reported a 58% net income growth as Chairman and CEO Brian Moynihan said the bank’s businesses regained the organic customer growth momentum last seen before the pandemic thus applauding the outstanding results.
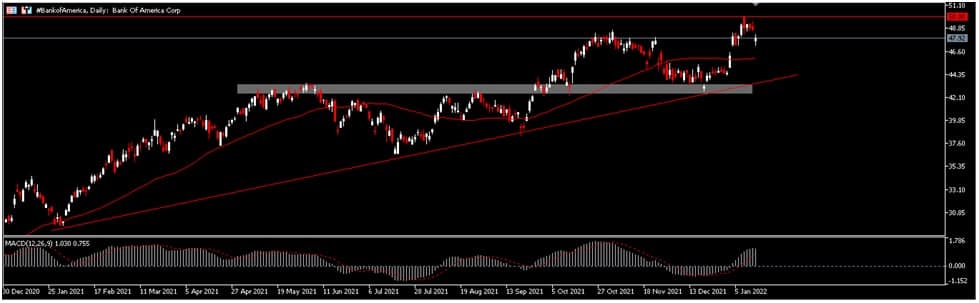
#BankofAmerica Daily
#BankofAmerica has also remained on a steady bullish run since hitting pandemic lows reached in March, 2020 around $18 and has continued to print higher lows and higher highs on its way up to the stock’s all time high at $50. Recent support around $43 served as the latest stepping stone for the price, supported by the support trendline coming from the start of 2021 around $29; with the price sitting well above the 50-day moving average,which could serve as support, the MACD showing the bulls are in control and the expectation of another solid quarter financials, it might well be on its way to retest $50 if things pan out as markets expect.
Morgan Stanley
 Earnings History and Projections
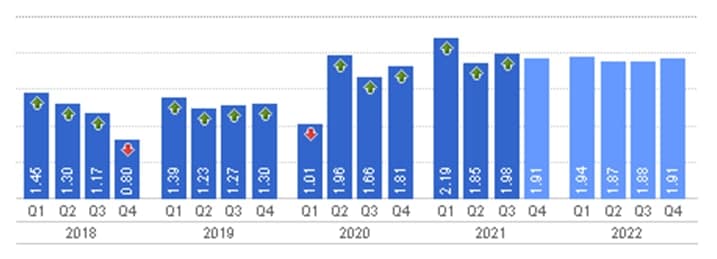
Source: CNBC
Morgan Stanley is also scheduled to release its financial results on the 19th of January before market open. Analysts at Zacks project $2 earnings per share, (down from $2.04 in the previous quarter but up 4.17% from $1.92 in the same period last year) on $14.77 billion in revenue, (down from $15.05 billion in the previous quarter but up 8.27% from same period a year ago.) Analysts mostly hold a moderate buy rating on the stock and rightly so, considering the stellar 48% growth in the share price in 2021, the standout performance in Q3 helping the bank achieve a record net new asset of $135 billion in Wealth Management, robust revenue, and improved efficiency producing an ROTCE (return on average tangible common shareholders’ equity) of 20%, taking the total combined client assets to $6.2 trillion according to Chairman and CEO James Gorman.
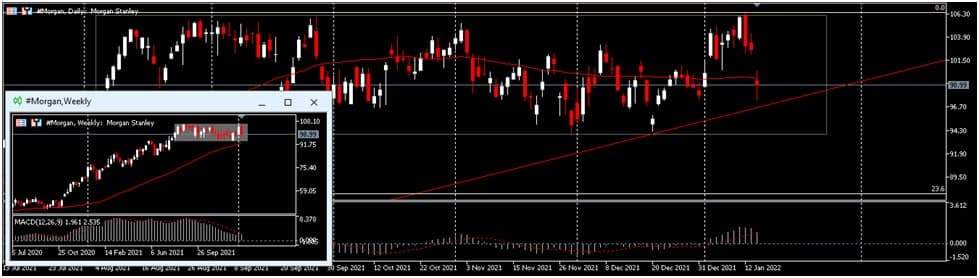
#Morgan Daily
Technically, #Morgan has been trading within a range for over 5 months since August, 2021 between $94 and $106.5 and has failed to see any meaningful momentum to break out. The 50-day moving average is lost in between price action and sits in a neutral position for the time being. Although, it is important to note that this range sits at the top of the stock price after rallying like the other banks since pandemic lows around $27 and has already seen an impressive rally of almost 300% in that time period and may be due a correction. Near term support comes in at $96.5 and further down the bottom of the range while overhead resistance sits at the top of the range around $106.
Click here to view the economic calendar
Heritage Adisa
Market Analyst – HF Educational office – Nigeria
Disclaimer: This material is provided as a general marketing communication for information purposes only and does not constitute an independent investment research. Nothing in this communication contains, or should be considered as containing, an investment advice or an investment recommendation or a solicitation for the purpose of buying or selling of any financial instrument. All information provided is gathered from reputable sources and any information containing an indication of past performance is not a guarantee or reliable indicator of future performance. Users acknowledge that any investment in Leveraged Products is characterized by a certain degree of uncertainty and that any investment of this nature involves a high level of risk for which the users are solely responsible and liable. We assume no liability for any loss arising from any investment made based on the information provided in this communication. This communication must not be reproduced or further distributed without our prior written permission.


