


USDCAD, H1
Canada’s CPI rose to a 4.8% pace in December from the 4.7% growth rate in November. CPI fell 0.1% after the 0.2% gain in November. The average of the BoC’s three core CPI measures was 2.9% in December, up from 2.8% in November. The important Trimmed CPI annualised reading rose to 3.7% from expectations of a “no change” reading at 3.4%. Prices rose in all eight major components on a year-over-year basis in December. Transportation and shelter prices contributed the most to the increase in the CPI. Year over year, prices for services (+3.4%) rose at a faster pace in December compared with November (+2.9%). Prices for goods (+6.8%) grew at a slightly slower pace than in November (+6.9%), moderating the price growth in the CPI. Gasoline prices rose to a lesser extent in December (+33.3%) than in November (+43.6%), contributing to the slowdown in goods prices.
US housing starts rose 1.4% to 1.702 mln in December, much better than expected, especially after jumping 8.1% to 1.678 mln in November and edging up 0.1% to 1.552 mln in October. Starts hit a 15-year high of 1.725 mln in March. All of the strength on the month was in the multifamily sector where starts increased 10.6% to 0.530 mln from the 0.2% rise to 0.479 mln. Single family starts declined -2.3% to 1.172 mln versus the 11.6% surge to 1.199 mln previously. Starts under construction increased 2.3% to 1.519 mln versus the 1.4% prior gain to 1.485 mln. But housing completions fell -8.7% to 1.295 mln after bouncing 13.0% to 1.418 mln in November. Permits climbed 9.1% to 1.873 mln following the 3.9% increase to 1.717 mln in November and a 15-year high of 1.883 mln last January.
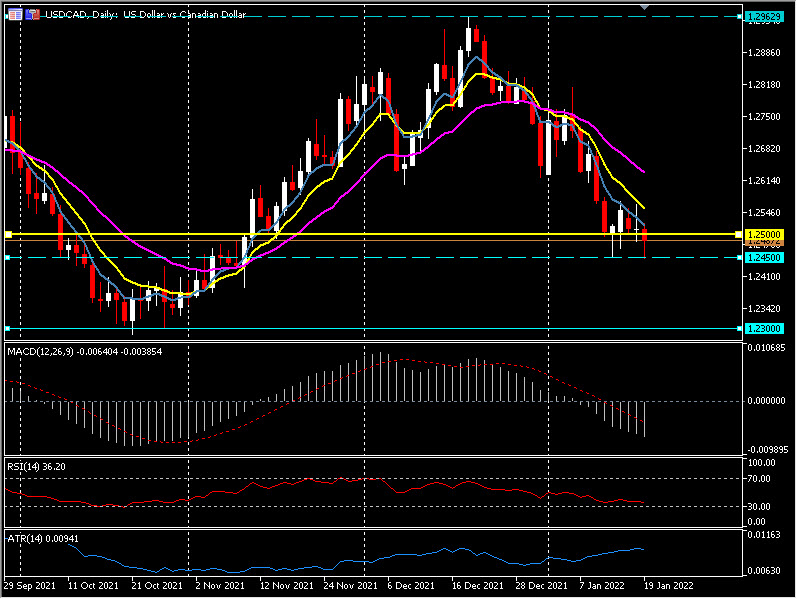
The data spiked USDCAD down to test last week’s low around the 1.2450 zone and a new 10-week low. The rally in the Oil market has supported the CAD over the last 5 weeks when USDCAD touched 1.2960 and USOil was testing under $66.00 a barrel. Today USOil breached $87.00. 1.2500 remains the major psychological level representing both support in the higher time frames (200-day moving average) and resistance in the lower time frames (20-hour moving average).
Click here to access our Economic Calendar
Stuart Cowell
Head Market Analyst
Disclaimer: This material is provided as a general marketing communication for information purposes only and does not constitute an independent investment research. Nothing in this communication contains, or should be considered as containing, an investment advice or an investment recommendation or a solicitation for the purpose of buying or selling of any financial instrument. All information provided is gathered from reputable sources and any information containing an indication of past performance is not a guarantee or reliable indicator of future performance. Users acknowledge that any investment in Leveraged Products is characterized by a certain degree of uncertainty and that any investment of this nature involves a high level of risk for which the users are solely responsible and liable. We assume no liability for any loss arising from any investment made based on the information provided in this communication. This communication must not be reproduced or further distributed without our written permission.


