


Mexico
In their latest meeting, the Central Bank of Mexico hiked rates for the 7th time in a row, to 6.5% – the highest level since March 2020 – saying “global inflation continues to rise, driven by bottlenecks, and high food and energy prices”, adding that the geopolitical conflict in Europe has contributed to the upward pressure for domestic prices. Recent economic data have been positive, with annual Inflation hitting 7.28%, Retail Sales increasing to 6.7%, the Unemployment rate increasing in Feb to 3.7% from 3.6% but well off the 5.4% level seen in mid-2020, and trade balance at 1.293 billion peso – a massive jump as Mexico benefits from the rising Oil prices.
Banxico increased its inflation forecast for 2022 from 4% estimated back in February to 5.5%; with the medium term forecast for inflation revised higher, should the bank maintain their hiking cycle, and coupled with the good economic performance, this could translate into further strength for the Mexican Peso.
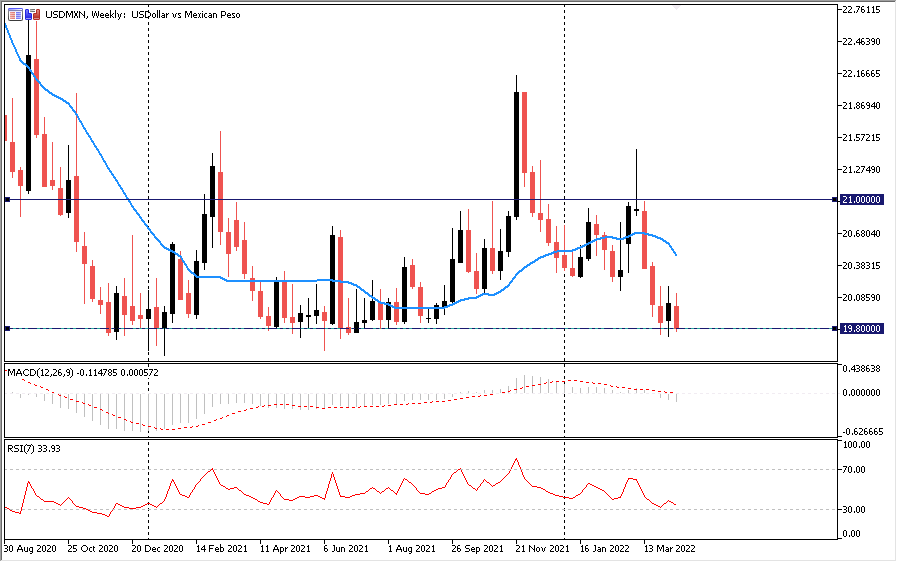
USDMXN is down about 3.3% so far in 2022 and down about 7.8% from the highs of the year printed in March to 19.800, a key level that has held as support throughout the last year and served as resistance over the last couple of years. Price below the 20 SMA signifies that sellers are still in control, but at such key levels, some pullback is not out of the question especially as future expected hikes could affect demand and cause a slowdown which would eventually be bad for the currency – the RSI is trading in oversold territory on the daily charts. Heading into Q2, barring a slowdown in the economy, the higher interest rates and the possible good economic performance should see the Mexican Peso appreciate against the USD but sellers will need to clear 19.800 to be in full control, with the next support level coming from early 2020 at 18.700.
China
The Chinese economy is slowing due to shrinking demand, rising costs, strain in the property sector, weak credit growth, the Ukraine conflict and a COVID-19 resurgence which has triggered another set of restrictions and could further disrupt global supply chains. The People’s Bank of China (PBOC) is stepping up its stimulus efforts; it is expected to ease monetary policy going forward to provide support and revive the economy thus working towards its 5.5% growth target this year, and there is also expectation for further fiscal support. This should help stimulate the Chinese economy but could be a headwind for the Yuan.
The US is in a tightening cycle, expected to hike interest rates up to 7 times in total this year following rising inflation which is now at 8.4%, the highest level in 40 years, and this is expected to strengthen the USD. This policy divergence between the US Federal Reserve and the PBOC could spur capital outflows from the Chinese economy, weaken the Yuan and see USDCNH create fresh highs for the year.
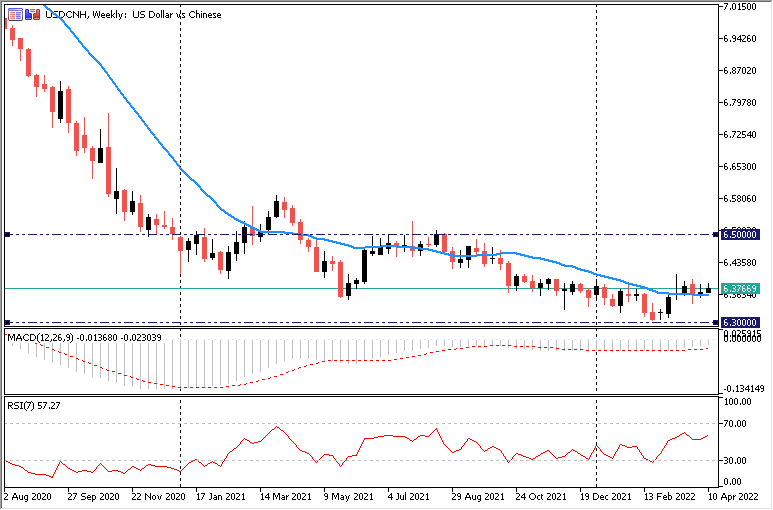
So far this year, USDCNH has traded mostly sideways, finding a floor around the 6.3000 levels last seen in 2018. Looking at the weekly chart, price has closed back above the 20 SMA for the first time this year, the RSI holds onto the midway line and has more room either way, but the MACD and signal line remain below the zero level. The 6.2500-6.3000 area could serve as support for the pair with overhead resistance coming in at 6.5000.
South Africa
The latest SARB monetary policy meeting saw the bank hike its interest rate for the third time, to 4.25%, in a bid to curb rising inflation, citing ongoing supply shortages, aggressive policy easing and the outbreak of the Russia-Ukraine war as factors that have sent commodity and energy prices spiraling. The bank also revised higher its near-term inflation forecast but expects it to remain within the target band between 3-6%.
Rising commodity prices are supporting the South African economy as a net exporter of commodities, which should help reduce the output gap, but recent data have been mixed, with the unemployment rate increasing to 35.30%, current account and trade balance in negative territory and CPI falling to 5.7% while Retail Sales more than doubled to 7.7% when released in March. Further interest rate hikes and improvement in the economy is good for the Rand which should continue to display strength against the USD.
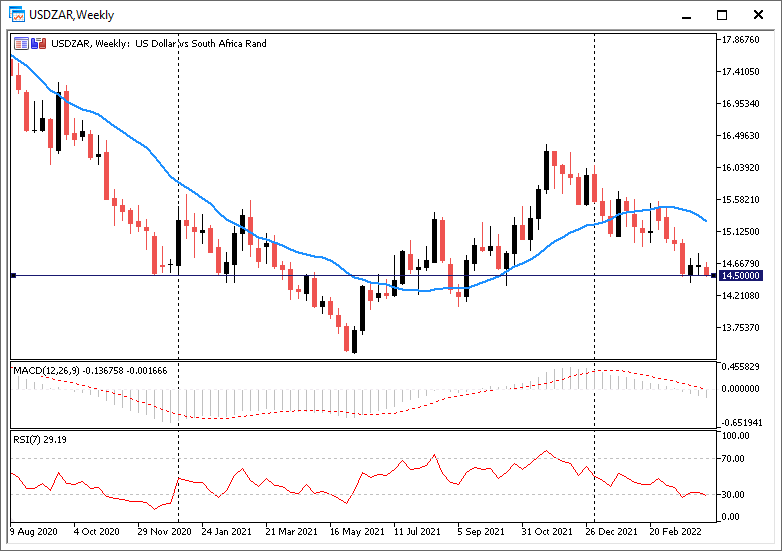
So far this year, the USDZAR pair is down about 8% to around 14.500 – a key level going back as far as 2017. Looking at the weekly chart, the pair is trading below the 20 SMA, holding the downside pressure with the MACD also in negative territory and the RSI trading below the 50 level. The next level of support comes in around 14.000 which coincides with the trendline coming from the lows of 2018 while the 20 SMA could serve as an overhead resistance if it bounces off 14.500.
Turkey
Inflation in Turkey continues to persist with the latest consumer inflation data hitting a fresh 20-year high of 61% as the fall in the Lira, rising energy and commodity prices, supply constraints, and tensions between Russia and Ukraine contribute to the sky-high inflation and worsen the case for the net importer of energy. Despite persistently high inflation, the CBRT maintained the interest rate at 14% in its latest meeting saying it is conducting a comprehensive review on its policy framework to set the stage for disinflation and it will use all available instruments till a reduction in inflation to the 5% target is achieved over the medium term to stabilize prices.
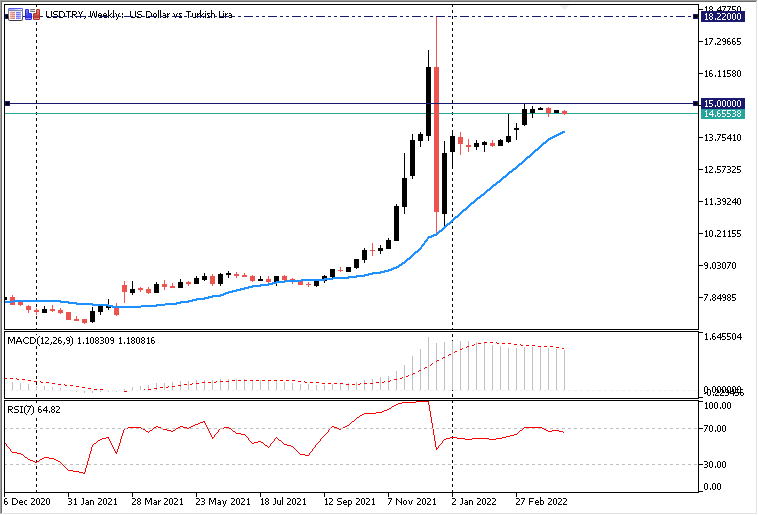
The Turkish Lira has fallen about 11% against the US Dollar this year, currently trading around 14.67. Looking at the weekly chart, USDTRY continues to slope upward trading above the 20 SMA with the MACD histogram and signal line well above zero and the RSI trading above the average level but yet to reach overbought regions. Heading into Q2, high and persistent inflation remains the key macro-economic problem for the Turkish economy and that should continue to be a headwind for the Lira against the USD with overhead resistance coming in at 15.00.
Russia
The Russian economy has been facing an uphill battle after the US and its allies laid on heavy economic sanctions that target the travel sector, military equipment importation and oligarchs with links to the Kremlin, Oil exportation and the financial sector following its invasion of Ukraine on February 24. This has led to higher prices for the Russian people with domestic inflation hitting 9.2% – a level last seen in 2016 – scarcity of raw materials for manufacturers and imported goods for consumers, and international businesses pulling out of Russia.
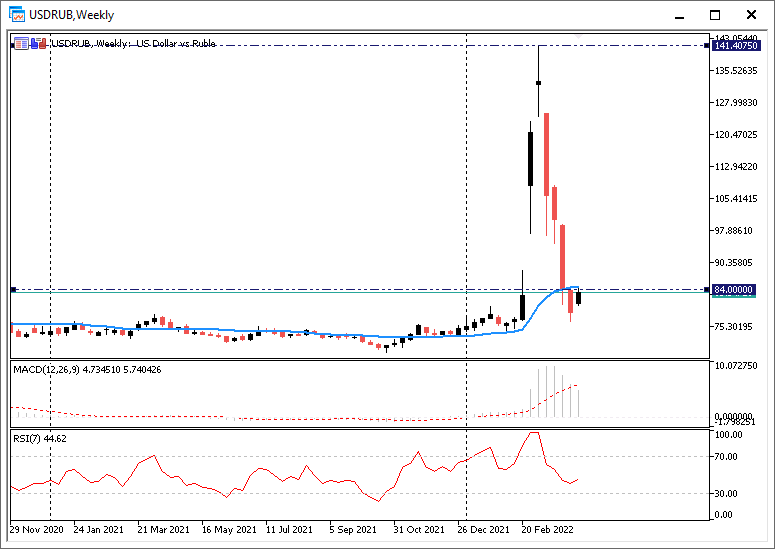
The Central Bank of Russia more than doubled its interest rate to 20% in late February and left it steady in its March meeting, stressing the risk to high inflation and uncertainty that lies ahead with growth expected to shrink but not allow inflation to spiral. However, earlier this week they have reduced it to 17%. Actions from the Central Bank of Russia have helped the currency recover sharply from all-time lows against the USD, around 140 hit in early March, to 84 USDRUB now. Russia’s attempt to sell its Oil in Rubles could help support the value of the currency but the strain on the economy remains a headwind. Going forward, the value of the currency will be highly dependent on the developments on the geopolitical side.
Before the tensions, USDRUB had traded mostly sideways but has since traded in wide swings and now trades back close to 2020 highs around 84.00 . On the weekly chart, the 20 SMA currently holds price as support with the MACD histogram and signal line still well above 0 while the RSI sits on the halfway line. With huge uncertainty ahead for the Russian Economy, the RUB is expected to weaken further vs the USD as the bullish outlook supports the Greenback.
Click here to access our Economic Calendar
Heritage Adisa
Market Analyst
Disclaimer: This material is provided as a general marketing communication for information purposes only and does not constitute an independent investment research. Nothing in this communication contains, or should be considered as containing, an investment advice or an investment recommendation or a solicitation for the purpose of buying or selling of any financial instrument. All information provided is gathered from reputable sources and any information containing an indication of past performance is not a guarantee or reliable indicator of future performance. Users acknowledge that any investment in Leveraged Products is characterized by a certain degree of uncertainty and that any investment of this nature involves a high level of risk for which the users are solely responsible and liable. We assume no liability for any loss arising from any investment made based on the information provided in this communication. This communication must not be reproduced or further distribution.


