US stocks have slumped sharply since their January 2022 peak: USA500 is nearing a bear market after losing more than -19%; USA100 plunged more than -28%; USA30 lost more than -15%; Bitcoin continues to move lower, losing more than 50% of its high price as the crypto world is rocked by the stablecoin fiasco. Bonds started to rise alongside the USD and JPY as investors sought a hedge. Global yields are slowly starting to look downwards.

Brutal volatility continues to grip financial markets, with threats that global central bank policies will plunge the global economy into recession. The caution born of gradual rate hikes, as data showed prices paid to US producers rose more than expected in April, reinforces bets that the Fed will further tighten policy. US Treasury Secretary Janet Yellen stated that the inflation rate in the country is the number one economic problem facing the government today. Meanwhile, the US Senate voted 80-19 in favor of granting Federal Reserve Chairman Jerome Powell another four-year term in the central bank’s driving seat.
The US Dollar had fallen hard against the Japanese yen during trading on Thursday, due to the risk aversion surrounding the market. The Japanese yen is considered a safe currency and has been oversold. There is more downward pressure on all JPY-related pairs.The JPY was up 1.24% against the USD in Thursday trade, 2.6% against the EUR, 1.7% against the GBP, 2% against the NZD and 2.3% against the AUD.
The Yen has weakened against most major currencies so far this year. As we know, there is a strong correlation between the interest rates of the 10-year US bonds and the USDJPY pair. On Monday, the US10Y rate hit 3.2% and the USDJPY pair set its maximum price for the year at 131.24 levels. The last four days have been marked by a marked decline in the US10Y rate and a stronger Yen.
Technical Overview
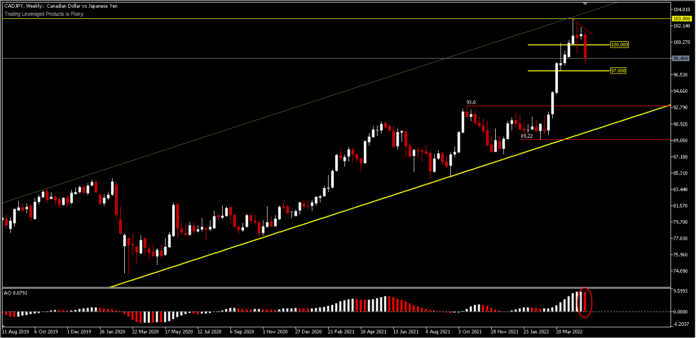
CADJPY – The pair has gained more than 1,350 pips since the start of the year, which equates to a 15% JPY loss against the CAD. The last 3 weekly candles have long upper wicks, indicating weak demand. On the weekly chart, AO is entering a downward phase. Comparing historical data, usually changes in the histogram on AO indicate that this trend will continue in the coming weeks.
The H4 chart shows the consolidation which has broken out, while the triangle formation is taking place. The price slid to the downside breaking the 99.00 support and the 200-period EMA. This can be seen from the validation of 2 oscillators on the lower side and the intersection of the Tenken Sen and Kinjun Sen 2 times above the kumo. A further downside move will test the 97.00 support first. On the upside, the retracement could hit the 100.00 mark again before prices act further in the week ahead.
Click here to access our Economic Calendar
Ady Phangestu
Market Analyst – HF Educational Office – Indonesia
Disclaimer: This material is provided as a general marketing communication for information purposes only and does not constitute an independent investment research. Nothing in this communication contains, or should be considered as containing, an investment advice or an investment recommendation or a solicitation for the purpose of buying or selling of any financial instrument. All information provided is gathered from reputable sources and any information containing an indication of past performance is not a guarantee or reliable indicator of future performance. Users acknowledge that any investment in Leveraged Products is characterized by a certain degree of uncertainty and that any investment of this nature involves a high level of risk for which the users are solely responsible and liable. We assume no liability for any loss arising from any investment made based on the information provided in this communication. This communication must not be reproduced or further distribution.


