Google, H4
Without key data releases markets concentrated on geopolitics and the wealth of US corporate earnings updates, revitalized GDP growth, and ECB double-speak on the policy outlook. US equities are flat-to-lower given renewed declines on stocks globally amid heightened trade war tensions, though the massive release of corporate earnings due this week will keep investors on their toes. Indeed, it will be interesting to learn just how the difference between tax cut windfalls and ratcheting up of trade tariffs plays out on corporate balance sheets.
The day is very busy,with 40% of the S&P reporting their earnings in the US. The agenda has Alphabet (Google), Cadence Design, Halliburton, Hasbro, Illinois Tool, TD Ameritrade, Whirlpool, and Zions Bancorporation.
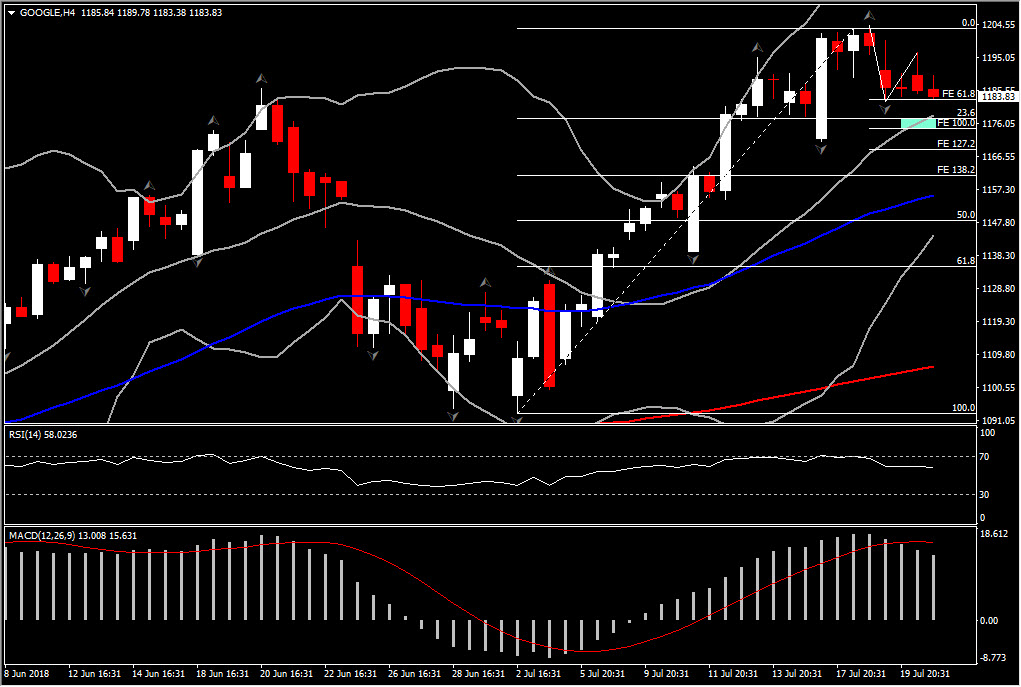
Google stock price has been moving within a ranging market in the 4-hour chart the past 2 days with the upper barrier at the 1204.20 peak and the lower barrier at the 1182.36. The stock is fluctuating in an upchannel since March.
Currently the price retests for the 4th consecutive session the lower boundary of the range, at the FE 61.8 which is at the 1183.00 level, presenting the possibility of turning to the negative bias in the medium term. Meanwhile, the momentum indicators show slight decline of the positive momentum, as RSI is off its peaks at 58 from 69, while MACD lines are getting weaker below trigger line but within the positive area. The Daily momentum indicators however, remain on the positive outlook for the pair, suggesting that weakness will be short-lived.
On the downside, immediate Support is set at latest swing low today at 1182.36, while the next one is coming at the confluence of 20-period MA and 23.6% Fibonacci retracement level at 1178.00. An opening today below this area, could seen stock price drifting towards the 1150.00 level which is the 50 % Fibonacci retracement set on July’s rally. This would turn the outlook from positive to negative. Deeper decline could drift the prices to 200-period MA at 1106.00. Resistance comes at the round 1200.00 level.
Click here to access the Economic calendar
Andria Pichidi
Market Analyst
Disclaimer: This material is provided as a general marketing communication for information purposes only and does not constitute an independent investment research. Nothing in this communication contains, or should be considered as containing, an investment advice or an investment recommendation or a solicitation for the purpose of buying or selling of any financial instrument. All information provided is gathered from reputable sources and any information containing an indication of past performance is not a guarantee or reliable indicator of future performance. Users acknowledge that any investment in FX and CFDs products is characterized by a certain degree of uncertainty and that any investment of this nature involves a high level of risk for which the users are solely responsible and liable. We assume no liability for any loss arising from any investment made based on the information provided in this communication. This communication must not be reproduced or further distributed without our prior written permission.


