


On Friday, Fed Chairman Jerome Powell spoke during the Jackson Hole Symposium regarding monetary policy in a changing economy. In addition to the hints about how policy is expected to unwind in the coming years, the Chairman also spoke of an important measure which always weighs on the policy decisions to be made: the natural rate of unemployment.
Natural rate vs the NAIRU
The natural rate of unemployment is probably one of the concepts most used by decision-makers. The concept was developed by Milton Friedman in 1968 and challenged some widely-accepted principles which prevailed during the period. In particular, economists believed that lower unemployment would result in higher inflation, while higher unemployment would mean lower inflation. This came to be known as the “trade-off between unemployment and inflation”. Friedman, in contrast to popular opinion, suggested that while this may hold in the short-run, there appears to be no long-run trade-off between inflation and unemployment. This happens because the economy adjusts (in the long-run) to any average rate of inflation, and so unemployment returns to what he named as the “natural” rate. As such, the natural rate of unemployment (usually defined as the average unemployment through time) does not depend on average inflation and hence monetary policy cannot have an impact on it.
The natural rate of unemployment should not be confused with the “Non-Accelerating Inflation Rate of Unemployment,” or NAIRU, which is the unemployment rate consistent with stable inflation. This means that any actual unemployment rate above NAIRU would suggest a decrease in inflation, while actual unemployment below NAIRU would increase inflation. While the natural rate and the NAIRU appear to be similar, there is a crucial difference between the two: the natural rate of unemployment refers to the short-run, and is the rate which is expected to be observed once the short-run effect of cyclical factors (such as those characterising labour demand and supply, e.g. demographics, skilled vs unskilled workers, etc.) gradually plays out over time. In contrast, the NAIRU should be interpreted as a shorter-term indicator, signifying the rate consistent with steady inflation in, e.g. the coming year. The two concepts are quite close together that some refer to them as the long-term natural rate and the short-term natural rate (NAIRU).
How are they used?
The role of natural rate of unemployment, other than reminding policymakers that average unemployment cannot be lowered through monetary policy, is to serve as a benchmark for any stabilization objectives. Remember that the natural rate means the rate which will prevail once the short-term dust from cyclical fluctuations (i.e. recessions, one-off events, market booms, etc) settles. Monetary policy can have an impact on these short-term factors, in the sense that it can help smooth out fluctuations and hence allow the economy to reach the natural rate more easily. Hence, knowing where the unemployment rate would lie in the absence of any short-term distortions would mean that monetary policy has a direction as to where the unemployment rate should potentially be. Furthermore, understanding whether the actual unemployment rate is higher or lower than the natural rate means that a view is provided regarding whether higher or lower inflation can be expected in the future.
The shorter-run effects captured by NAIRU also play a role in the conduct of policy. The NAIRU, similar to the long-term natural rate, can help forecast future inflation, albeit at shorter timeframes. This can be particularly important for central banks aiming to target inflation. Unfortunately, given the shorter timeframe the NAIRU focuses on, its variability can be much higher, hence making it less suitable as a benchmark for basing policy actions upon.
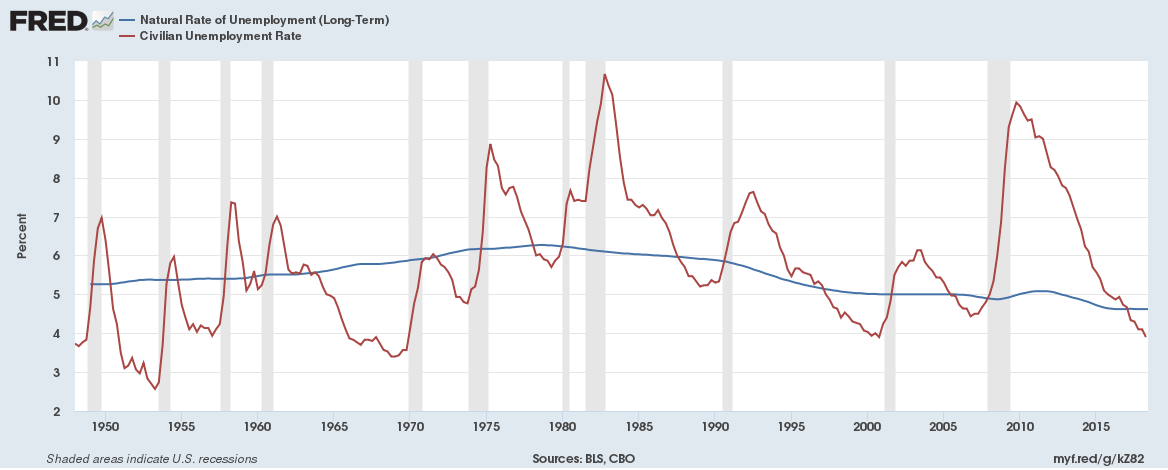
The figure above provides a good example of how monetary policy responds to the natural rate. If, for example, the gap between current and natural unemployment rate (unemployment gap) is rising, as in the 2008q2-2009q4 period then decreases in interest rates are to be expected in order to boost the economy. To confirm this, during 2008, the policy interest rate decreased from 4.5% to almost 0%. When the gap starts to decrease, and keeps decreasing, rate hikes can be expected. The closing of this gap was the reason some expected a rate hike as back as 2013, with the Fed finally increasing rates in December 2015.
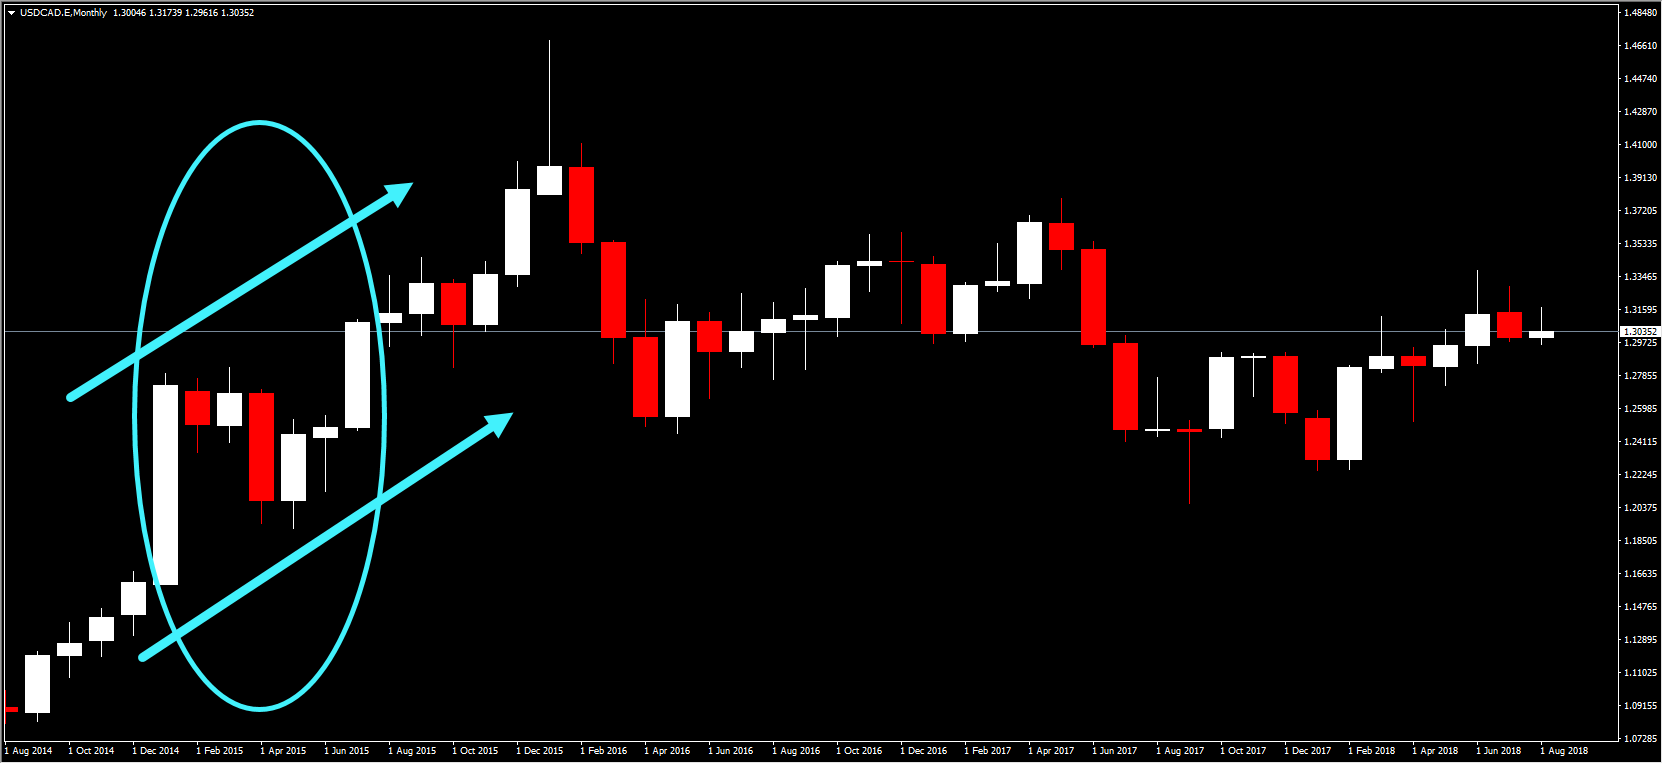
Expectations of a rate hike can be seen in the behaviour of the USDCAD rate during January 2015 to July 2015. During the period, no other rate change or any other economic events took place, with the political situation remaining relatively calm. As the figure below suggests, and as is summarised in the first figure of this post, the reduction in the unemployment gap led to expectations of higher interest rates which, as discussed in an earlier post, usually lead to exchange rate appreciations. In this case, the USD rose by almost 13% over these months, in response to the interest rate hike. The interest rate reduction by the Bank of Canada in late July led to further appreciation of the USD, which halted only after the interest rate hike in December 2015. Remember that markets trade in anticipation of changes in economic fundamentals, with new information forcing them to adjust their views. Until an actual rate hike took place, markets continued to expect it, forcing the USD higher.
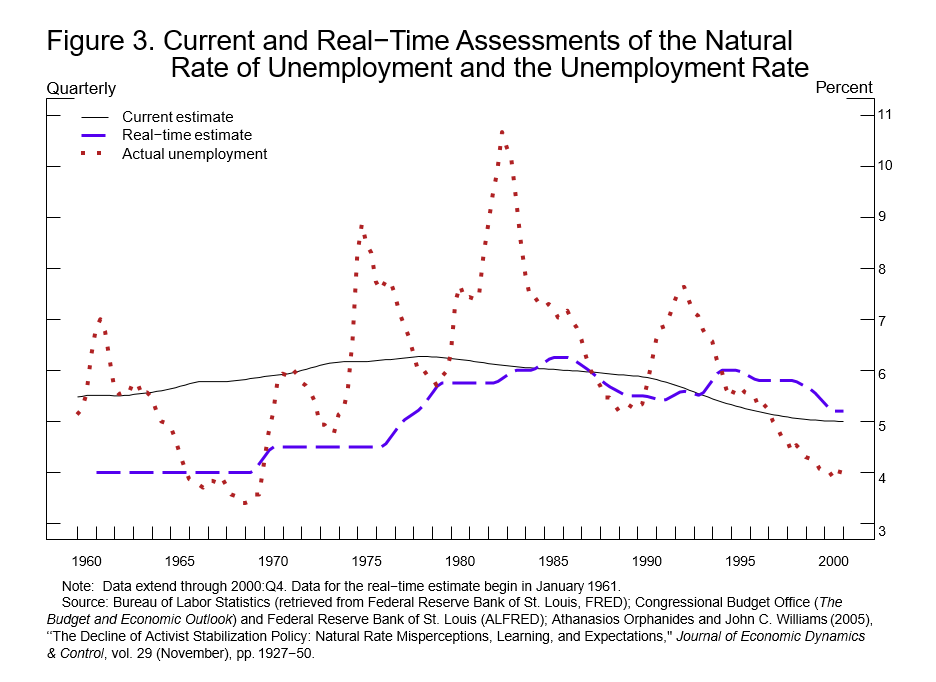
One final thought: calculating the natural interest and the NAIRU is more of an art than a science, given that several assumptions about cyclical fluctuations need to be made. Furthermore, given that smoothing techniques (akin to complicated moving averages) are employed in the estimation, then it means that real-time estimates can vary significantly from later estimates. This is why central banks, while taking both estimates into consideration, do not solely rely on these two indicators when it comes to setting interest rates. More on the indicators taken in consideration with regards to setting interest rates soon. Stay tuned!
Click here to access the HotForex Economic calendar.
Want to learn to trade and analyse the markets? Join our webinars and get analysis and trading ideas combined with better understanding on how markets work. Click HERE to register for FREE! The next webinar will start in:
[ujicountdown id=”Next Webinar” expire=”2018/08/28 14:00″ hide=”true” url=”” subscr=”” recurring=”” rectype=”second” repeats=””]
Dr Nektarios Michail
Market Analyst
HotForex
Disclaimer: This material is provided as a general marketing communication for information purposes only and does not constitute an independent investment research. Nothing in this communication contains, or should be considered as containing, an investment advice or an investment recommendation or a solicitation for the purpose of buying or selling of any financial instrument. All information provided is gathered from reputable sources and any information containing an indication of past performance is not a guarantee or reliable indicator of future performance. Users acknowledge that any investment in FX and CFDs products is characterized by a certain degree of uncertainty and that any investment of this nature involves a high level of risk for which the users are solely responsible and liable. We assume no liability for any loss arising from any investment made based on the information provided in this communication. This communication must not be reproduced or further distributed without our prior written permission.


