USOil, Daily and Weekly
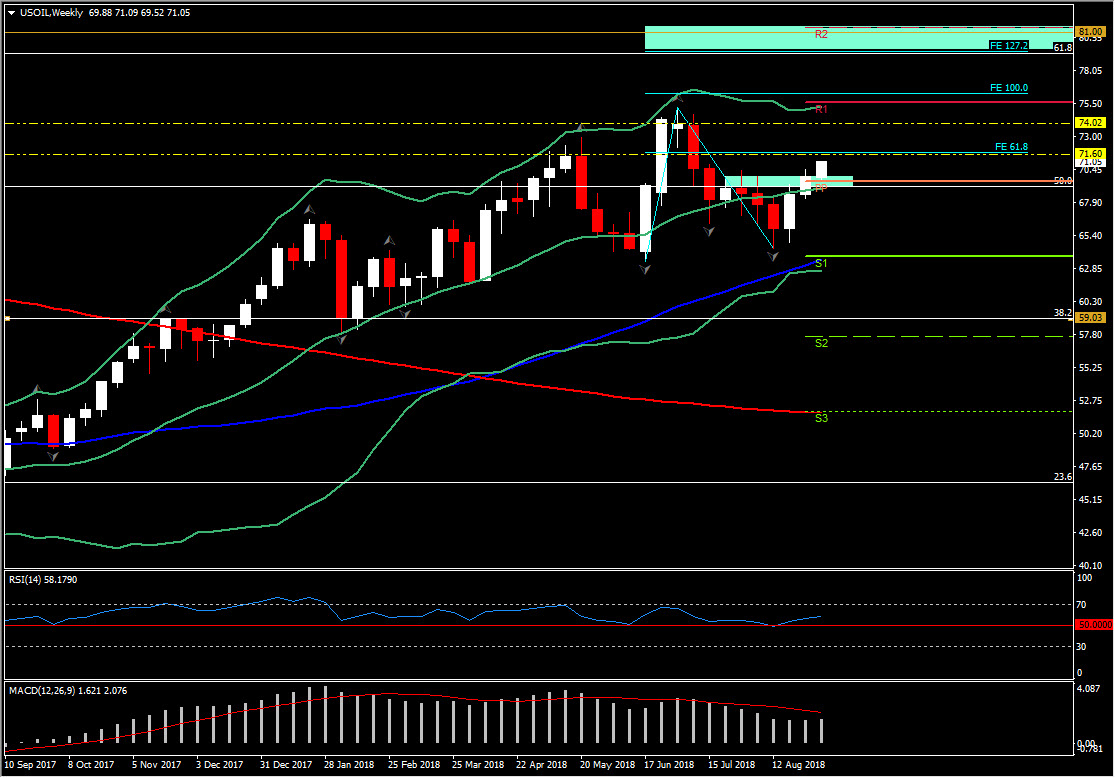
Front-month WTI crude prices are up by 1.4% at $71.09, having recouped from a 3-day low at PP level, at $69.51, breaking above last Thursday’s 7-week high at $70.50. This marks the end of the consolidation seen after rallying by over 8.5% from the mid-August low at $64.43, which was the lowest traded since mid-June. The liftback to levels above $70.0 came as US sanctions on Iran started to bite, but also as markets await for the resumption of what has proved to be difficult trade talks between the US and Canada. Negotiations will resume on Wednesday, so some hope of a deal remains, though there is a justifiable sense of wariness, following repeated disappointments in reaching a handshake.
Meanwhile, the US re-imposed sanctions on August 7 prohibiting Iran’s purchases of US Dollars and precious metals, and will add a second round of sanctions on November 4, which will directly target Iran’s energy sector. Even though the first round of sanctions didn’t specifically target crude, preliminary trade flow data last week showed that Iran’s crude oil and condensate exports are set to drop by 70 mln barrels, for the first time since April 2017 (according to Thomson Reuters Eikon).
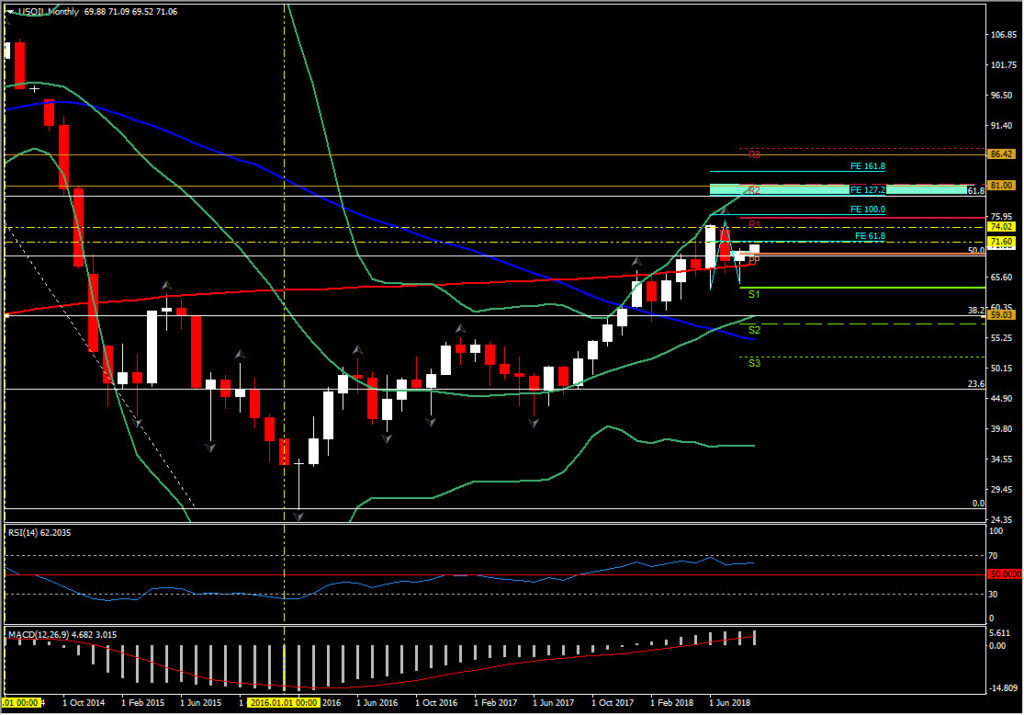
Taking a technical look at USoil, the energy asset is likely to continue being traded with some further upside strength. The overall positive picture comes initially, as it is traded for a second consecutive week, within upper Bollinger Bands and strongly supported by 50-week SMA since September 2017. The long-term oscillators, like RSI, suggest that the upside momentum has further steam to the upside, as RSI is above neutral sloping positively. MACD presents an inverse picture as it is decreasing below its signal line, however it is still well above the neutral zone.
Hence,on the upside, after the break of the $70.50 barrier, the next Resistance levels come at the 61.8% Fibonacci Extension at $71.60. A closing, today, above the latter could imply that bulls are trying to gain the control of the instrument and hence to retest the round $74.00 level. Further gains above this barrier could suggest a strong positive move, up to 2-year highs and the confluence of 127.2 FE and 61.8% Fibonacci level set since 2014 drift, at the $79.00- $81.00 area. This is considered to be a strong Resistance area, hence a retracement to the downside is possible once the asset manages to reach this area.
In case of a correction lower, immediate Support to declines may be found at the 50% Fibonacci level which coincides with the monthly pivot point at $69.50. A downside break of this Support level could open the way for the 3-month lows at $63.10-$63.30 area, marked by the June’s lows and the 50-week SMA. Even lower, declines may stall near 59.00 (38.2% Fibonacci level and 20-month SMA).
Click here to access the HotForex Economic calendar.
Want to learn to trade and analyse the markets? Join our webinars and get analysis and trading ideas combined with better understanding on how markets work. Click HERE to register for FREE! The next webinar will start in:
[ujicountdown id=”Next Webinar” expire=”2018/09/04 14:00″ hide=”true” url=”” subscr=”” recurring=”” rectype=”second” repeats=””]
Andria Pichidi
Market Analyst
HotForex
Disclaimer: This material is provided as a general marketing communication for information purposes only and does not constitute an independent investment research. Nothing in this communication contains, or should be considered as containing, an investment advice or an investment recommendation or a solicitation for the purpose of buying or selling of any financial instrument. All information provided is gathered from reputable sources and any information containing an indication of past performance is not a guarantee or reliable indicator of future performance. Users acknowledge that any investment in FX and CFDs products is characterized by a certain degree of uncertainty and that any investment of this nature involves a high level of risk for which the users are solely responsible and liable. We assume no liability for any loss arising from any investment made based on the information provided in this communication. This communication must not be reproduced or further distributed without our prior written permission.


