USA500, Daily
September is traditionally a poor month for stock markets. It ranks 8th out of the 12 months of the year and with 3 of the worst trading days of the entire year. When I say worst I should clarify: I mean the chance of a stock market (the UK100 and USA500 in particular) rising in September is only 54%. (The worst is May and the best is January at 49% and 76% respectively). On a daily basis it looks even bleaker: it is the only month to have three entries in the top ten worst days of the year and all three of those days are in the top 5. September 26 is the worst day of all with only a 28% chance of a price rise. Moreover, the first few days of October also have two entries in the top ten. So trade with caution in the next couple of weeks. Five of the worst trading days of the year confined to a four-week stretch is anything but random. My source (since 1999) is the Schwartz Stock Market Handbook, a reference and companion for many of my stock market decisions during the year with data that runs back to 1919.
But why should this be so? In all honesty no one knows why. All I am reporting are trends that have been identified and that have been running for decades. It’s not an opinion or guesswork; it’s simple facts based on an analysis of the closing prices of stock markets all the way back to when record-keeping began after World War I. With a real Trade War likely to ramp up, between the two largest economies in the world as early as this week, September 2018 has much already in place to follow the trends of previous years.
There are similar trends and surprising clustering of days for the best trading days of the year. They are coming later in the year and will be the subject of another article.
If that is what history and sentiment suggest then what of the technicals for September 2018 ?
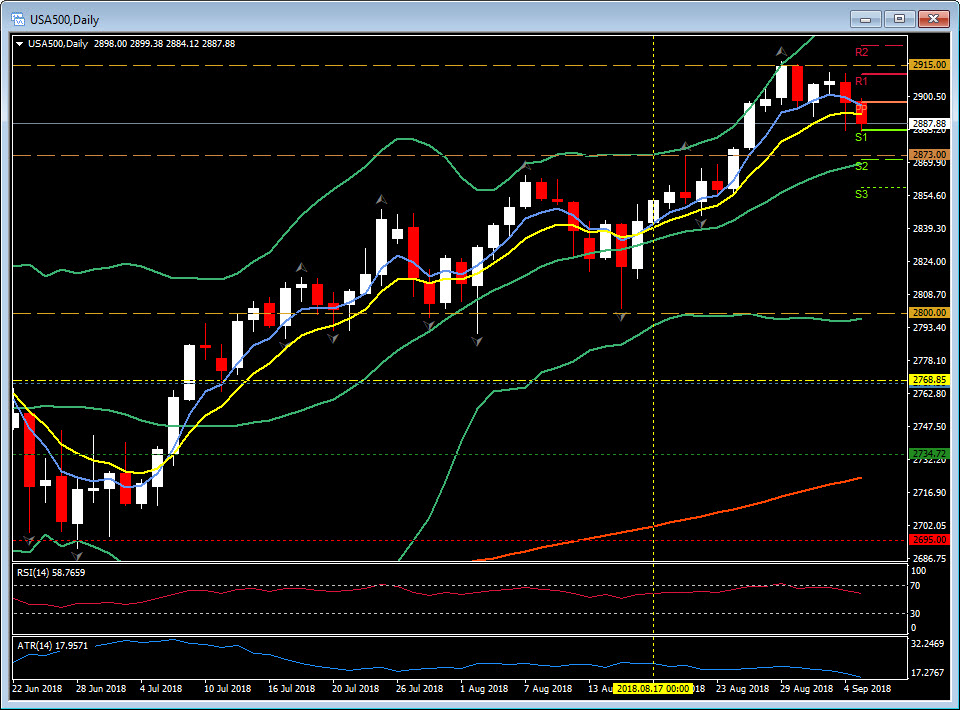
The USA500 bull market remains intact at the weekly and monthly time frame, the daily has shown signs of fatigue recently. However, the daily chart holds the key 20 day moving average, which now sits with the S2 level around the 2870 zone. A breach of this level and the S3 at 2850 and the lower Bollinger band and August low at 2800 comes into play. The all-time high posted at the end of August at 2915 remains the first target for US equity bulls.
Click here to access the HotForex Economic calendar.
Want to learn to trade and analyse the markets? Join our webinars and get analysis and trading ideas combined with better understanding on how markets work. Click HERE to register for FREE! The next webinar will start in:
[ujicountdown id=”Next Webinar” expire=”2018/09/05 14:00″ hide=”true” url=”” subscr=”” recurring=”” rectype=”second” repeats=””]
Stuart Cowell
Head Market Analyst
HotForex
Disclaimer: This material is provided as a general marketing communication for information purposes only and does not constitute an independent investment research. Nothing in this communication contains, or should be considered as containing, an investment advice or an investment recommendation or a solicitation for the purpose of buying or selling of any financial instrument. All information provided is gathered from reputable sources and any information containing an indication of past performance is not a guarantee or reliable indicator of future performance. Users acknowledge that any investment in FX and CFDs products is characterized by a certain degree of uncertainty and that any investment of this nature involves a high level of risk for which the users are solely responsible and liable. We assume no liability for any loss arising from any investment made based on the information provided in this communication. This communication must not be reproduced or further distributed without our prior written permission.


