


EURCHF, H4 and Daily/Weekly
EURCHF rose back toward 1.1300 amid a broader Euro bid, though the cross remains well off yesterday’s 2-week high at 1.1342 yesterday.
The Franc has recently been intermittently in demand as a safe haven currency (particularly when the Turkish Lira and/or Italian assets have been under pressure), although a long Franc position has been made an expensive carry by SNB given the -0.75% deposit rate, and the currency has been prone to quick unwinding of long positions. Strong Swiss GDP data for Q2 last week, questioned the need for SNB’s aggressively-loose monetary policy, though with inflation remaining benign, the central bank may not be ready to signal a policy shift given the risk for further episodes of Franc-supporting risk aversion stemming from emerging markets and/or escalation in trade protectionism. SNB will be looking to time its tightening with ECB tightening.
The EURCHF has traded bearishly since May, remaining though in a positive path since the 2015 drift. This week, the pair gives some positive vibes for the near future, as it rebounded on Monday from the key Support area, at year’s low and 61.8% Fibonacci retracement level set from 2017, at 1.1180-1.1150. For the past 2 days, it is holding close to 2-week peak, retesting the 20-day SMA and the 50.0% Fibonacci level, at 1.1330 and 1.1316 respectively.
Meanwhile, by observing the performance of the pair since May, we have also noticed that it seems to be forming the Elliot Wave theory, as it is presenting so far a 5-waves move in the downtrend. Theoretically, such move is followed by 3 corrective waves (a 5-3 move). Technically-wise, all the above, along with a closing above the 1.1330 Resistance level, could signal the possibility of 3 corrective moves to the upside. Daily momentum indicators have slightly improved in the last month, by making higher lows, however they are still moving below the neutral zone, something that suggests that the outlook remains negative overall. RSI is at 41 while MACD lines and signal line have been flattened into the negative territory, suggesting that the pair might enter a consolidation mode.
Daily/Weekly: A close above the 20-day SMA and the 2-week peak, at 1.1330 – 1.1343, may meet resistance around the 1.1465-1.1470 Resistance area, this being the latest up fractal in the daily chart and the confluence of 50-day SMA and upper Bollinger Bands pattern. In case of further upside extensions, the price could re-challenge the 1.1635 level, taken from 200-day SMA.
In the case of a turn back at the bottom of 2018, the break of the 61.8% Fib. level could imply a “free fall” for EURCHF as the next Support comes at 200-day SMA and the round 1.1000 level.
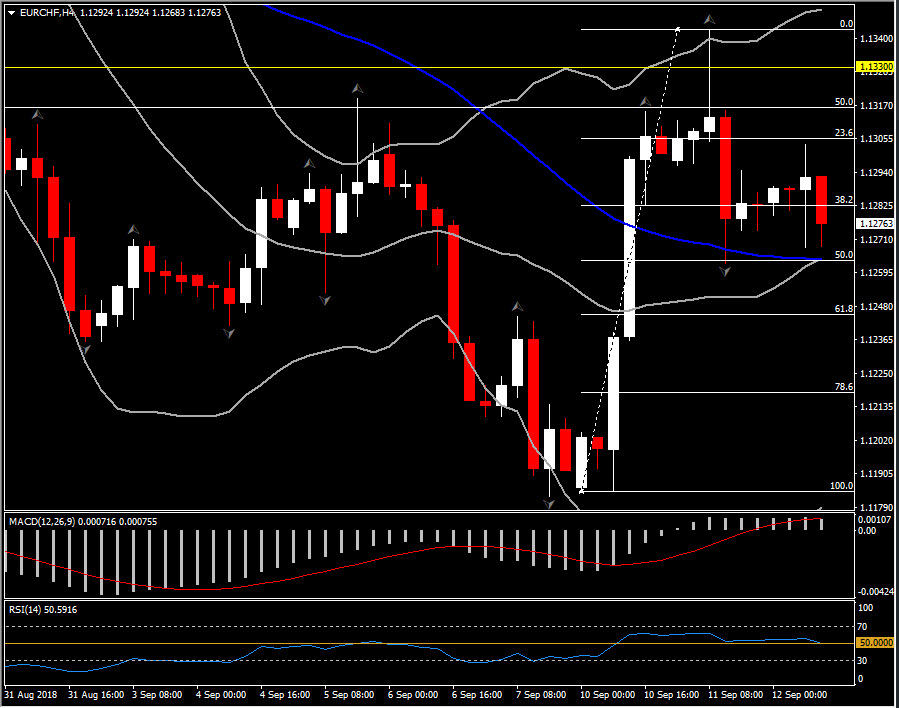
Intraday (H4): The pair moved downwards after London open and it is currently retesting the confluence of 20- and 50-period SMA and 50% Fib. level since Monday’s rally. Support holds at this confluence, hence a closing of the latest H4 candles below 1.1260 could then target the area around the 1.1200 hurdle.
Click here to access the HotForex Economic calendar.
Want to learn to trade and analyse the markets? Join our webinars and get analysis and trading ideas combined with better understanding on how markets work. Click HERE to register for FREE! The next webinar will start in:
[ujicountdown id=”Next Webinar” expire=”2018/09/13 15:00″ hide=”true” url=”” subscr=”” recurring=”” rectype=”second” repeats=””]
Andria Pichidi
Market Analyst
HotForex
Disclaimer: This material is provided as a general marketing communication for information purposes only and does not constitute an independent investment research. Nothing in this communication contains, or should be considered as containing, an investment advice or an investment recommendation or a solicitation for the purpose of buying or selling of any financial instrument. All information provided is gathered from reputable sources and any information containing an indication of past performance is not a guarantee or reliable indicator of future performance. Users acknowledge that any investment in FX and CFDs products is characterized by a certain degree of uncertainty and that any investment of this nature involves a high level of risk for which the users are solely responsible and liable. We assume no liability for any loss arising from any investment made based on the information provided in this communication. This communication must not be reproduced or further distributed without our prior written permission.


