


Correlation, in a purely statistical sense, examines how close two variables are in having a linear statistical relationship with each other. Correlation is usually measured as a percentage, ranging from -100% to +100%, while other notations specify it to stand from -1 to +1, which is essentially the same thing. Overall, a relationship close to -100% suggests that the two variables have a close negative linear relationship, i.e. that as one decreases, the other is expected to increase. If correlation is close to +100% then the two variables are said to have a positive relationship, i.e. if one increases, the other is also expected to increase. If correlation is close to 0, then the two variables are said to exhibit no evidence of a linear relationship. The percentage associated to the relationship essentially specifies the number of times that a co-movement occurred. For example, a 70% correlation suggests that in 7 out of 10 times, if variable X increases then variable Y will also increase. Naturally, the possibility of having a 100% correlation between two variables is very small, given that other factors are also likely to have an impact on the relationship.
Note that evidence of a linear relationship between two variables does not suggest the direction of this relationship. To put it differently, if variable X and variable Y have a correlation of 90%, there is no indication whatsoever that either X causes Y or Y causes X. It only says that the two variables move in unison, and not whether variable X affects variable Y or vice versa. Still, the direction of causation does not really matter in many applications and neither it does when it comes to FX trading.
The table above, obtained through HotForex Premium Tools – Correlation Matrix, shows the correlation between various types of pairs. The main diagonal is left empty given that the correlation of a variable with itself is, by definition, 100%. Note that in this example, I have used 200 observations (i.e. close to one year), at a daily frequency. Naturally, traders wishing to observe shorter-term relationships can arrange this for e.g. 1-minute charts. As regards the choice of sample, there are two consideration traders should bear in mind: larger samples usually lead to more concrete (i.e. correct) estimates, however, they may not be very good in showing short-term changes in the relationship. Hence, the proper selection of data range and the trading frequency is left to the trader to decide.
The table presents correlations on the basis of the strength in the relationship. For example, no relationship can be viewed in green colour, weak relationship with a blue colour, medium relationship having an orange colour, while strong relationship is depicted in red. For example, the AUDCAD pair appears to have a strong correlation with the AUDUSD pair, standing at 86%, while it has a negative relationship with USDCNH at -80%.
The relationships between these three pairs appears interesting but one point needs to be borne in mind: given that in FX markets pair reflect the value of one currency versus another, the relationship between AUDCAD and AUDUSD should not come as a surprise given that AUD is common in both. As such, these types of relationships do not provide more information to the trader than he previously had. If AUD rises because of a positive development in Australia, then it is more than expected that both AUDCAD and AUDUSD would also rise.
On the other hand, the negative relationship between AUDCAD and USDCNH provides more food for thought. For example, it could be the case that the AUD and the CNH are correlated positively, also given that Australia is employed as a proxy for Asia’s performance. Hence, an increase in the AUD would also make the CNH rise, which would mean that the USDCNH would drop. Another interesting relationship which can be found in the table is that the price of Gold, either in Euros or in Dollars, is positively related to the AUDCHF pair. This occurs mostly because Australia is a main exporter of Gold thus an increase in the price of Gold would boost the country’s potential. Bitcoin, on the other hand, appears to have a positive relationship with AUDJPY and a negative relationship with the USDIndex, with the latter suggesting that perhaps Bitcoin can be viewed as a safe haven against the Dollar. This is also supported by the 44% positive relationship between BTCUSD and XAUEUR, which albeit weak, also points to that direction.
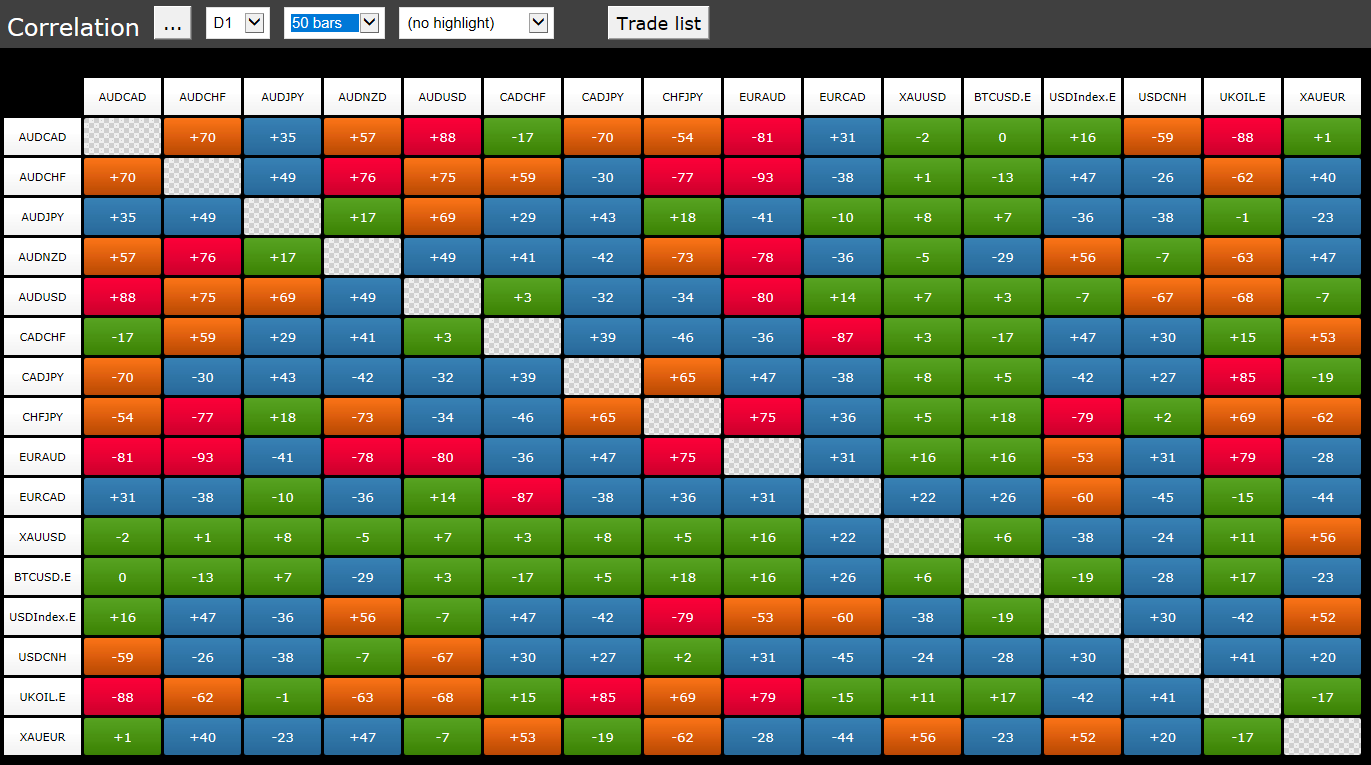
In order to examine whether these relationships hold in the shorter term, we have reduced the number of observations to the most recent 50 data points. As the correlation matrix suggests, many relationships have changed, with some even changing signs. However, the strength between some still remains. For example, the link between UKOIL and AUDCAD appears to be even stronger, at -88% compared to -80% in the 200-observation window, while the AUDCAD and USDCNH relationship has weakened to -59%. Remember that a substantial amount of observations is required to draw more concrete conclusions, thus the results in this case should be viewed with even more caution.
Overall, understanding the relationship between two currency pairs can assist in creating more successful trading strategies. However, given that there will never be a 100% relationship, care still needs to be taken and proper stop loss levels should be placed.
Click here to access the HotForex Economic calendar.
Want to learn to trade and analyse the markets? Join our webinars and get analysis and trading ideas combined with better understanding on how markets work. Click HERE to register for FREE! The next webinar will start in:
[ujicountdown id=”Next Webinar” expire=”2018/10/16 14:00″ hide=”true” url=”” subscr=”” recurring=”” rectype=”second” repeats=””]
Dr Nektarios Michail
Market Analyst
HotForex
Disclaimer: This material is provided as a general marketing communication for information purposes only and does not constitute an independent investment research. Nothing in this communication contains, or should be considered as containing, an investment advice or an investment recommendation or a solicitation for the purpose of buying or selling of any financial instrument. All information provided is gathered from reputable sources and any information containing an indication of past performance is not a guarantee or reliable indicator of future performance. Users acknowledge that any investment in FX and CFDs products is characterized by a certain degree of uncertainty and that any investment of this nature involves a high level of risk for which the users are solely responsible and liable. We assume no liability for any loss arising from any investment made based on the information provided in this communication. This communication must not be reproduced or further distributed without our prior written permission.


