


Productivity is essentially a measure of the production efficiency in an economy. In order to measure this efficiency, productivity is expressed as the ratio of output to inputs used in a production process. For example, productivity per worker divides the total amount of goods produced by all the workers by their number. Despite its apparent simplicity, productivity can be widely applied to a wide range of outputs, from firm-specific to macroeconomic ones. Productivity measures are usually found in the annual reports of many firms, while most economies produce at least an annual estimate of productivity.
The reason productivity is important is straightforward: increasing productivity can raise living standards because more goods and services are produced at the same amount of time and hence income (which in economics is the same as production) will also rise. Further to this, productivity can also have social benefits: higher productivity means that production targets can be met in less time hence people will (at least in theory) have more time for leisure, education, etc. For businesses, higher productivity assists in boosting profitability as more goods are produced with the same available resources (both human and non-human). Hence, cost per good produced is lowered and profitability increases without having to resolve in price increases.
Productivity is also a way to keep inflation down. If demand increases and production is more or less fixed, prices will rise. However, if demand increases and productivity also rises then the two will cancel each other out and hence no increase in prices is observed. To this end, productivity is an important measure of economic performance, and one which Central Banks take well in consideration when it comes to reaching their interest rate decisions.
Macroeconomic productivity can be divided in two parts: first, labour productivity which offers a measure of the human capital’s productivity over a specific period of time, is usually measured by dividing total output by total hours worked by all workers. Second, when all inputs (labour and capital) are considered in the productivity equation then we have what is known as Total Factor Productivity (TFP), which is the measure most often used by Central Banks and one which is usually employed. In essence, TFP measures the residual growth which cannot be explained by the rate of change in labour and capital. TFP is often interpreted as an average measure of productivity by factors such as technological and organizational innovation. This can include many factors which can potentially affect production activity such as technological innovations, education, management practices, better quality of raw material, etc.
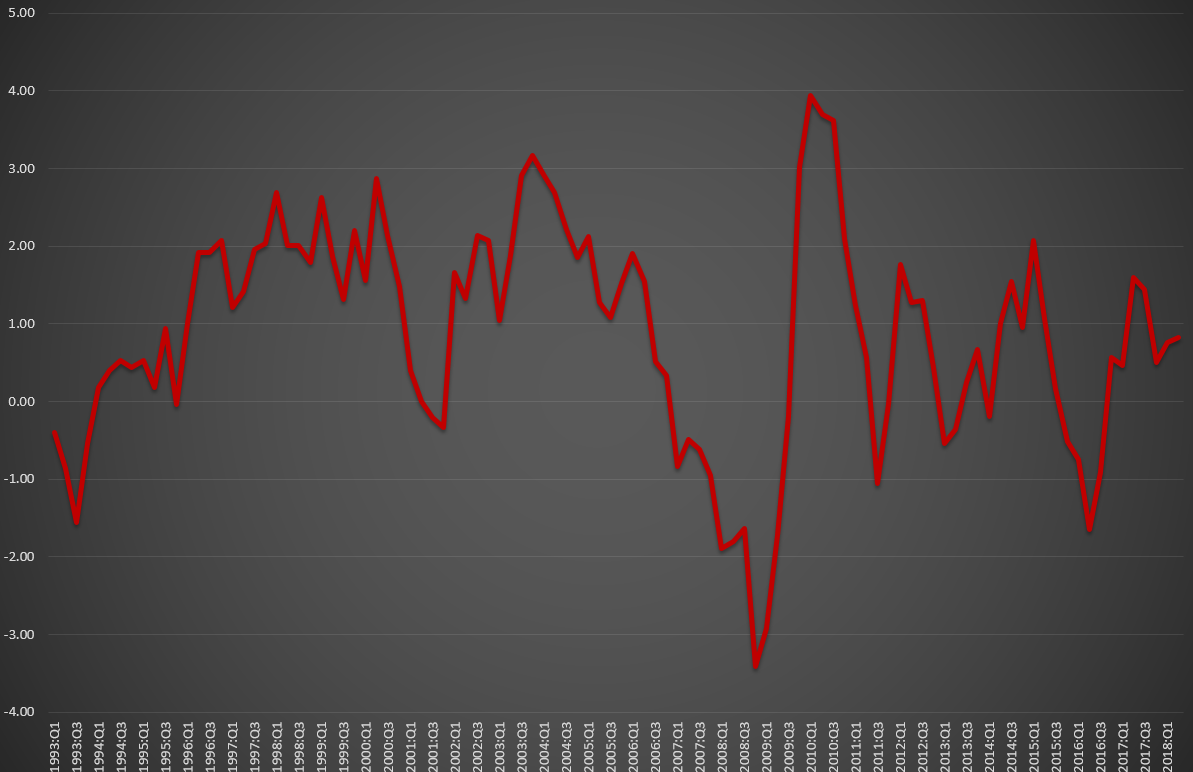
Given that TFP is measured as a residual, it is hard to be accurate in its measurement. For example, it is often the case that in one quarter productivity growth can be high and in the next it can be low (see Chart above), perhaps also due to measurement error which can be large in different periods of time. Thus, while the cyclical nature of productivity is evident, it is not always clear whether the ups or downs are worth noting. To this end, it is much better to employ a moving average of the productivity series such as the Chart below.
In particular, I have employed a 4-quarter moving average of one of the two series in the previous graph. Given that they both move closely together and differences are only methodological, using the other would have made very little difference. As we can observe, the productivity slowdown began around 2006 when growth started registering significant and persistent declines. By the time the financial crisis erupted, productivity growth was already persistently negative. A similar thing also happened in the 2000-2001 period as the dot-com bubble created a small recession, in which negative productivity growth also took place. As such, productivity growth can also serve as a leading indicator of recessions and overall economic performance.
Click here to access the HotForex Economic calendar.
Want to learn to trade and analyse the markets? Join our webinars and get analysis and trading ideas combined with better understanding on how markets work. Click HERE to register for FREE! The next webinar will start in:
[ujicountdown id=”Next Webinar” expire=”2018/10/23 14:00″ hide=”true” url=”” subscr=”” recurring=”” rectype=”second” repeats=””]
Dr Nektarios Michail
Market Analyst
HotForex
Disclaimer: This material is provided as a general marketing communication for information purposes only and does not constitute an independent investment research. Nothing in this communication contains, or should be considered as containing, an investment advice or an investment recommendation or a solicitation for the purpose of buying or selling of any financial instrument. All information provided is gathered from reputable sources and any information containing an indication of past performance is not a guarantee or reliable indicator of future performance. Users acknowledge that any investment in FX and CFDs products is characterized by a certain degree of uncertainty and that any investment of this nature involves a high level of risk for which the users are solely responsible and liable. We assume no liability for any loss arising from any investment made based on the information provided in this communication. This communication must not be reproduced or further distributed without our prior written permission.


