AMEX, Daily and Weekly
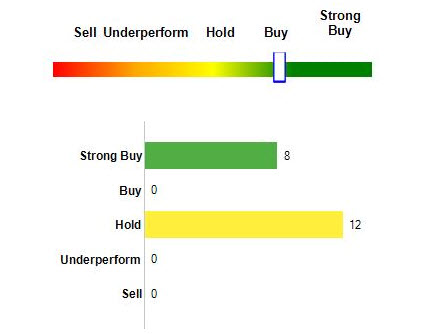
American Express’ third Quarter earnings for 2018 will be reported after the US Market close today at 21:00 GMT. The consensus recommendation for the company is “neutral to buy” corresponding to the majority of the consensus recommendation for the Online Services peer group , as 12 out of 20 Analyst Firms recommend remaining on hold and 8 suggest “Strong Buy” possibility.
Figure 1: Data Provider: Data is provided by Zacks Investment Research
According to Zacks Investment Research, the company is expected to report $1.78 earnings per share during the third Quarter of 2018, which represents a quarterly change of 18.7%. The Revenues number is projected to climb 18.9% to hit $10.03 billion. Similarly to last quarter, Earnings should increase from a possible revenue growth, which is anticipated to be positively driven by a global rise in the Card member spending, fee income and greater loan volumes.
According to Zacks Equity Research, in the first half of 2018, the company reported 1% YoY grow on card billed business and reached $580.3 billion. As per the Zacks Consensus Estimate, card billed business revenue is expected to be $296 billion, up 8.8% YoY.
Therefore it is widely expected that American express is likely to beat quarterly earnings estimated for the 7th time in a row. If the company achieved accuracy with its forecast, then a positive earnings outcome without any negative surprises on revenue could attract bulls back into the market, after 3 weeks of decline due to higher yields.
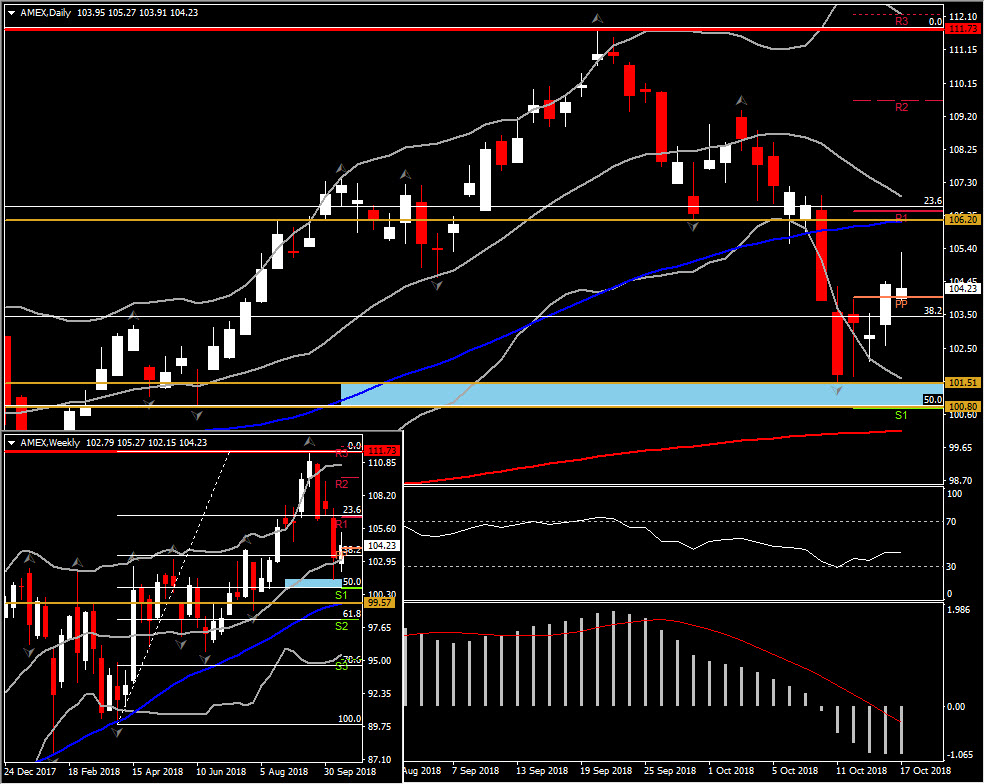
After the sharp drop by 19% over the past 3 weeks, a decisive turn above $106.20, could shift the attention to the $111.00 handle and the all-time peak at $111.74 .The $106.20 Resistance level reflects the 50-day SMA, which is also just a breath below weekly R1 and 50% retracement from September 21 decline. Hence, if price action manages to sustain a move above $105.75-106.20 area (38.2% Fib. level – 50-day SMA), is likely to turn to a bullish outlook again.
Contrarily, the extension lower for AMEX price, prior to the earnings announcement or even disappointing earnings outcome, could find immediate Support at the $100.80-101.52, which importantly is between the month’s bottom and the confluence of 50% Fib. level since April’s low and weekly S1 from PP analysis.
A break below this area could find Support at 50-week SMA at $99.50, which coexists with the latest weekly low fractal and the 61.8% Fib. level. Further decline could lead down to $98.30.
Turning to momentum indicators, the daily term outlook for the corporation’s shares remains bearish, with trading activity taking place below 20- and 50-day moving averages. RSI is sloping north but it still holds below neutral zone, suggesting weak momentum. MACD oscillator is strengthening its movement below the trigger and zero lines, strongly supporting the bearish momentum in the daily basis.
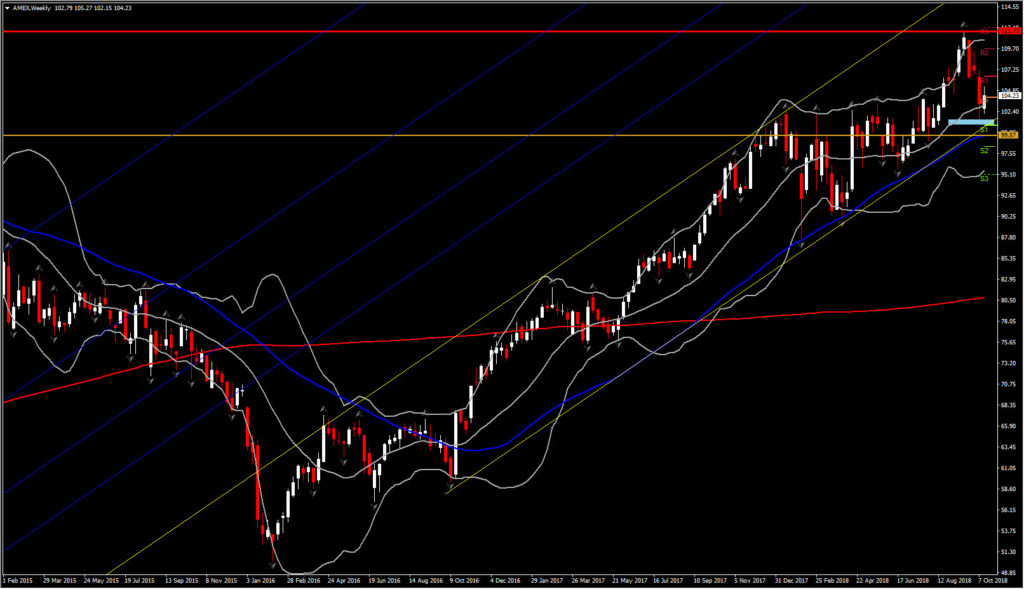
Regarding the medium-term picture, the market is expected to remain bullish as long as the stock price is developing within a trading range above the 50-weekly SMA, which is strongly supporting the stock since December 2016. In the long-term, Support holds on the lower trend-line of the uptrend channel set since October 2016. A strong movement below this Support could imply to the potential reversal of a 2-year rally.
Click here to access the HotForex Economic calendar.
Want to learn to trade and analyse the markets? Join our webinars and get analysis and trading ideas combined with better understanding on how markets work. Click HERE to register for FREE! The next webinar will start in:
[ujicountdown id=”Next Webinar” expire=”2018/10/23 14:00″ hide=”true” url=”” subscr=”” recurring=”” rectype=”second” repeats=””]
Andria Pichidi
Market Analyst
HotForex
Disclaimer: This material is provided as a general marketing communication for information purposes only and does not constitute an independent investment research. Nothing in this communication contains, or should be considered as containing, an investment advice or an investment recommendation or a solicitation for the purpose of buying or selling of any financial instrument. All information provided is gathered from reputable sources and any information containing an indication of past performance is not a guarantee or reliable indicator of future performance. Users acknowledge that any investment in FX and CFDs products is characterized by a certain degree of uncertainty and that any investment of this nature involves a high level of risk for which the users are solely responsible and liable. We assume no liability for any loss arising from any investment made based on the information provided in this communication. This communication must not be reproduced or further distributed without our prior written permission.


