


EURNZD, Daily
Italy continues to weigh on Euro, and is being one of the main factors of weakness this week. While the Dollar is benefiting from the Fed’s tightening course, the Euro side of the coin is plagued by signs of flagging economic momentum and rising yields in the Eurozone periphery.
More precisely, Spain and Portugal seem to be dragged also into the Italian asset slide today, as Portuguese, Spanish and Italian 10-year yields are all rising by 7.0 bp or more so far today, which is a reflector of investor anxiety around the Eurozone. Meanwhile, the pressure on Italian assets continues to mount after the European Commission, in a letter to Rome, called Italy’s spending plans “excessive”, even before the formal assessment of the fiscal plan.
Yesterday, ECB’s Draghi reportedly issued a stern warning at the EU summit and worryingly Spain and Portugal are now being dragged into the sell-off. Spain’s banks yesterday got a blow from a court ruling that will mean additional costs. While Spanish and Portuguese yields continue to look low compared to the Italian 10-year, which is trading at 3.75%, the fact that they are up 7.6 bp and 7.0 bp respectively, while Italy’s 10-year gained 7.1 bp this morning, will ring alarm bells in Frankfurt.
The German 10-year, meanwhile, has fallen back to 0.403%. The fact that Italy’s yield spread over Germany gets wider and hit the highest level since 2013, exposes the Euro further to the downside. Hence the jitters are unlikely to deter ECB from phasing out QE by the end of the year, but events will make Draghi even more determined to stress that asset purchases are part of ECB’s regular toolkit and could be revived if necessary.
From the data perspective, today did not provide any significant support to Euro. The Eurozone’s current account surplus widened to EUR 23.9 bln in August from EUR 19.5 bln in the previous month. The improvement was to a large extend due to a wider trade surplus, which will further add to Trump’s criticism of Germany’s export performance in particular. Indeed, the current account surplus widened to a whopping EUR 379 bln – or 3.3% of GDP in the 12 months to August this year, compared to EUR 330 bln – or 3% of GDP in the 12 months to August 2017.
EURUSD peaked at 1.1468 from a 10-day low at 1.1433, coming within 1 pip of the October 9 low, which is a 2-month nadir. However, the overall picture of EURUSD remains bearish as this is the 4th consecutive day the pair has clocked a lower low, and this week is set to be the 3 down week out of the last 4 weeks, with the Euro breaking out of what had been a broadly sideways chop, persisting for a month.
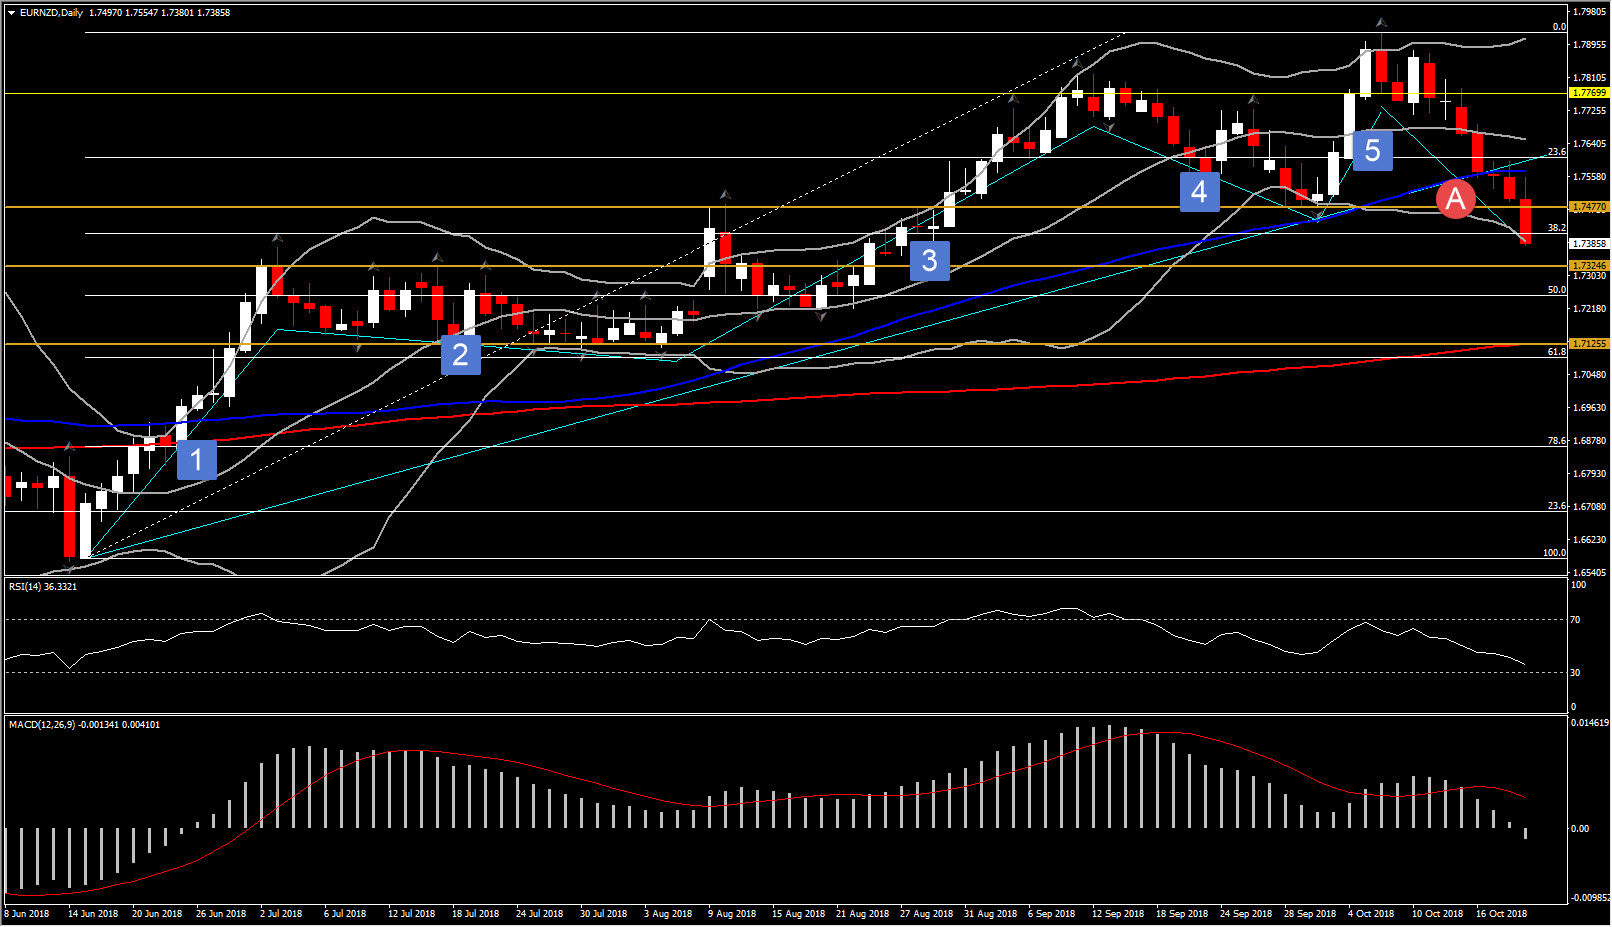
The biggest gainer though against Euro so far today is the Kiwi, as EURNZD is down by nearly 0.62%. The Euro weakness in combination with Kiwi outperformance, aided by strong inflation data, helped the pair to move lower, below a key Support level at September’s low, at 1.7477. The fact that the pair moves bearishly for the 7th consecutive day, below the 50-day SMA after crossing on Wednesday below the positive trendline set since June 14, turns the medium-term outlook from neutral to bearish.
From a technical side, momentum indicators confirm the strong bearish bias for the pair. The daily RSI is sloping negatively below the 50 zone, while MACD oscillator turned negative with signal line above neutral zone but looking to the downside. Meanwhile, the pair seems to form an Elliott Wave 5-3 formation, as it satisfied all the guidelines of the Elliott Wave Principle. Therefore, a close today below the 1.7477 which is September’s low, but also it coincides with Wave 4 low, could imply to the continuation of the decline for EURNZD. Next immediate Support holds at July’s resistance, at 1.7325, which also coincides with the mid of 38.2% and 50.0% Fib. level since June’s rally. Further decline could drive the pair at 200-day SMA, at 1.7125.
Hence today’s close price would be crucial for the pair’s future performance. Based on Elliott Wave theory, a correction to the upside could be seen at the future, however in order to claim that outlook has turned into a positive one, we must see a movement above the mid of October’s drift.
Current Resistance levels are set at 1.7570 (50-day SMA), 1.7600 and 1.7650 (20-day SMA & 50% retracement as of today).
Click here to access the HotForex Economic calendar.
Want to learn to trade and analyse the markets? Join our webinars and get analysis and trading ideas combined with better understanding on how markets work. Click HERE to register for FREE! The next webinar will start in:
[ujicountdown id=”Next Webinar” expire=”2018/10/23 14:00″ hide=”true” url=”” subscr=”” recurring=”” rectype=”second” repeats=””]
Andria Pichidi
Market Analyst
HotForex
Disclaimer: This material is provided as a general marketing communication for information purposes only and does not constitute an independent investment research. Nothing in this communication contains, or should be considered as containing, an investment advice or an investment recommendation or a solicitation for the purpose of buying or selling of any financial instrument. All information provided is gathered from reputable sources and any information containing an indication of past performance is not a guarantee or reliable indicator of future performance. Users acknowledge that any investment in FX and CFDs products is characterized by a certain degree of uncertainty and that any investment of this nature involves a high level of risk for which the users are solely responsible and liable. We assume no liability for any loss arising from any investment made based on the information provided in this communication. This communication must not be reproduced or further distributed without our prior written permission.


