


Overall, most economic indicators all traders rely on tell us how the market has fared in the past. For example, the CPI index tells us how prices evolved during last month, GDP results tell us how the economy fared in the last quarter, and even moving averages, which are used to establish decisions about the future, use past price data. In contrast, the Purchasing Managers’ Index (PMI) is a survey which aims at offering an idea as to how the economy is expected to move in the future. As such, they are among the most highly watched economic indicators.
PMI draws its name on account of the fact that it surveys purchasing managers at various businesses that make up a given sector. For example, the manufacturing PMI surveys firms in the manufacturing sector, while the services PMI surveys firms in the service sector. The idea behind the division is that manufacturing is more export-dependent and the services sector is more sensitive to the domestic economy, hence utilising both assists in capturing almost the whole economy. The exact questions and answers on the surveys vary based on the surveyor, with the most common surveyor being the Markit Group. PMI indices are released for the United States, many members of the Euro Area and other developed countries around the world. Traders all over the world use PMI surveys as leading indicators of economic growth, given that they provide insights into sales, employment, inventory and pricing. This is particularly true of the manufacturing sector, since purchases, which usually take place to support production, tend to react to consumer demand. As such, purchases are the first to decline at the first visible sign of a slowdown. Naturally, a one-off decline will not mean that the economy is facing issues but a persistent negative reaction could be interpreted as such. Similarly, a row of continued positive results should be considered as a sign that the economy is growing.
How are the indices calculated then? The survey simply asks whether an improvement, no change, or a deterioration of various dimensions of the business have taken place, such as New Orders, Factory Output, Employment, Suppliers’ Delivery Times, and Stocks of Purchases. An improvement gets numbered as 1, no change as 0.5 and a deterioration as 0. Then, these are weighted and an index is calculated. Overall, a reading above 50.0 suggests an improvement, while a reading below 50.0 suggests deterioration.
How do markets react to a PMI release?
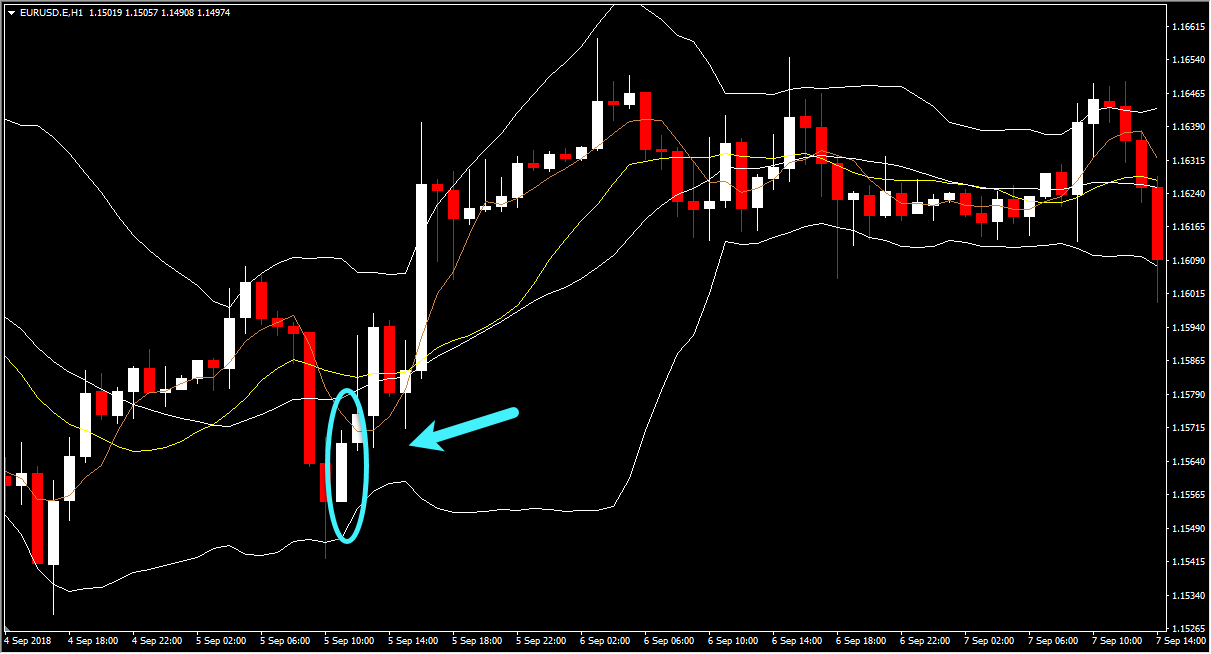
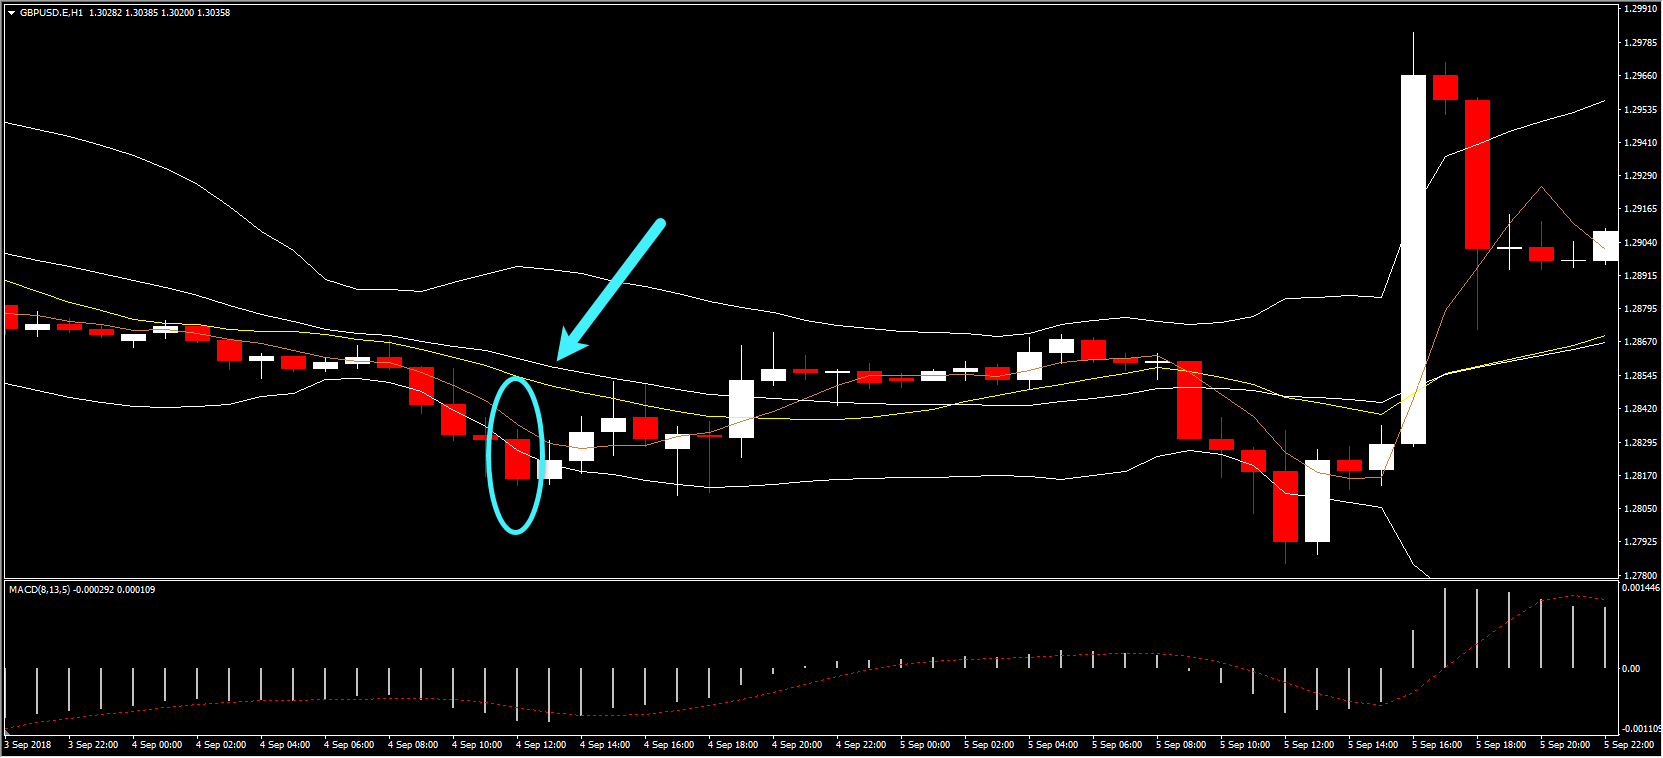
As expected, the FX market response lies in the difference between expectations and the actual data release. For example, on September 3, 2018 GMT 08:00, the Euro Area Manufacturing PMI came out as expected and hence no reaction was recorded. In contrast, a worse than expected outcome in the construction PMI for the UK pushed the Sterling down by about 140 pips. On a similar note, the Loonie declined against the Aussie when the former recorded worse than expected manufacturing PMIs. In contrast, when the Composite PMI (i.e. the combination of all PMIs) came out more positive than expected for the Euro Area, the Euro rose against the Dollar by 130 pips.
Click here to access the HotForex Economic calendar.
Want to learn to trade and analyse the markets? Join our webinars and get analysis and trading ideas combined with better understanding on how markets work. Click HERE to register for FREE! The next webinar will start in:
[ujicountdown id=”Next Webinar” expire=”2018/10/23 14:00″ hide=”true” url=”” subscr=”” recurring=”” rectype=”second” repeats=””]
Dr Nektarios Michail
Market Analyst
HotForex
Disclaimer: This material is provided as a general marketing communication for information purposes only and does not constitute an independent investment research. Nothing in this communication contains, or should be considered as containing, an investment advice or an investment recommendation or a solicitation for the purpose of buying or selling of any financial instrument. All information provided is gathered from reputable sources and any information containing an indication of past performance is not a guarantee or reliable indicator of future performance. Users acknowledge that any investment in FX and CFDs products is characterized by a certain degree of uncertainty and that any investment of this nature involves a high level of risk for which the users are solely responsible and liable. We assume no liability for any loss arising from any investment made based on the information provided in this communication. This communication must not be reproduced or further distributed without our prior written permission.


