


EURNZD, H4 and Daily
The Kiwi has been doing extremely well the past month, and more precisely after the inflation release on October 16, above expectations at 0.9% in Q3 after the 0.4% q/q rise in Q2. Recently the employment gain on November 7 was well in excess of projections, while the drop in the jobless rate was contrary to projections for a tick higher. This supported the New Zealand Dollar further, especially due to the global uncertainty on the political, geopolitical and even trade front.
Today meanwhile, the backdrop of mostly firmer stock markets in Asia, and a rise in US Equity index futures, were also a bullish lead for the relatively higher beta antipodean currency. Outperforming the Euro, at a time in which Europe remains fraught with risks, as the brinkmanship between Italy and the EU in terms of the budget continues to play out, Brexit uncertainty remains and there are signs of flagging economic growth momentum in the Eurozone.
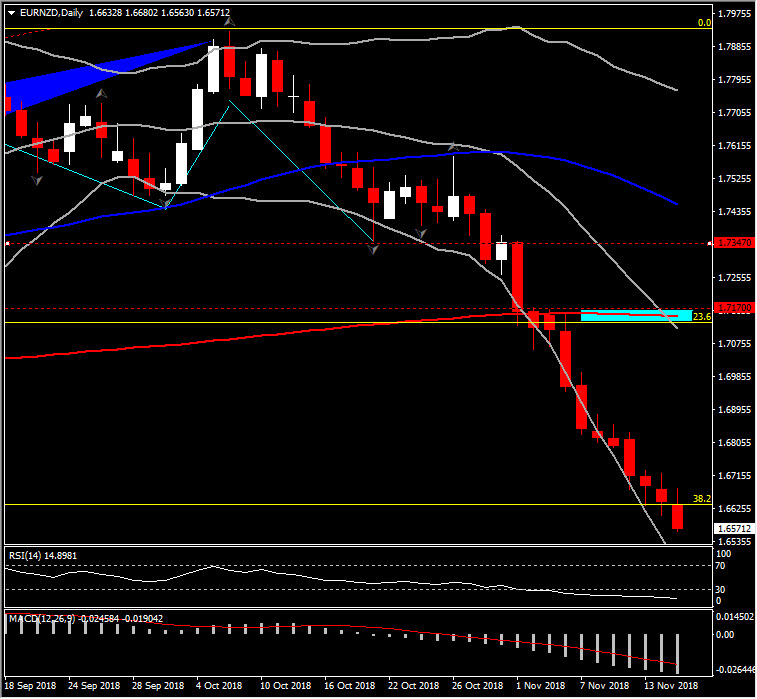
EURNZD continues its strong way down and today broke the 4-month low at 1.6567. This breakout below the 1.6630 Support level, was a key move in the long term, as it represents the 38.2% Fibonacci retracement since 2017 low but also strong 6-month Support between November 2017-April 2014, before the rebound of the pair up to 1.7900 area. Therefore, as the pair moves strongly to the downside for the 3rd consecutive week, ready to form 3 black weekly craws, it simply adds to the constant deterioration in the outlook.
Taking into consideration the constant declines of the price but also on momentum indicators, the pair remains strongly to the bearish outlook, without near term corrections signs yet.
On the weekly basis, the RSI is at 35 looking to the downside, following a smooth negative slope since October. MACD lines are decreasing to the downside below signal line, confirming the increase of negative bias. In the daily chart, RSI looks oversold. However, the bearish crossover of 20-day SMA to 200-day SMA, and as the MACD keeps extending to the downside, suggest that bears have the ultimate control.
Today’s break of the 4-month low, opened the doors for the 1.6235-1.6360 area, set at the latest swing lower (November 2017) and the 50% Fibonacci retracement level. Further losses could then target the 61.8% Fib. level at 1.5830.
However, as the pair remains in a sharp bearish price action, a clear reversal to the upside could only be confirmed with a move above the confluence of 50-week SMA, 20-day SMA and 23.6% Fib. level at 1.7100- 1.7170 area. This could open the doors for the continuation of the uptrend again.
As mentioned, in the wider picture, the pair remains in a bearish trend, while it confirmed 5 Elliott Waves movements and currently forms a corrective wave to the downside.
Click here to access the HotForex Economic Calendar
Andria Pichidi
Market Analyst
HotForex
Disclaimer: This material is provided as a general marketing communication for information purposes only and does not constitute an independent investment research. Nothing in this communication contains, or should be considered as containing, an investment advice or an investment recommendation or a solicitation for the purpose of buying or selling of any financial instrument. All information provided is gathered from reputable sources and any information containing an indication of past performance is not a guarantee or reliable indicator of future performance. Users acknowledge that any investment in FX and CFDs products is characterized by a certain degree of uncertainty and that any investment of this nature involves a high level of risk for which the users are solely responsible and liable. We assume no liability for any loss arising from any investment made based on the information provided in this communication. This communication must not be reproduced or further distributed without our prior written permission.


