


AUDUSD, AUDCAD, AUDJPY and AUDNZD
In contrast with last week’s performance, Aussie crosses have trimmed some gains for a 3rd consecutive day, with the bigger givers being the Yen, the Euro and the Kiwi. However as the near-term bullish sentiment continues to help Aussie, by reviewing the market, we identify the increase of bearish bias as well.
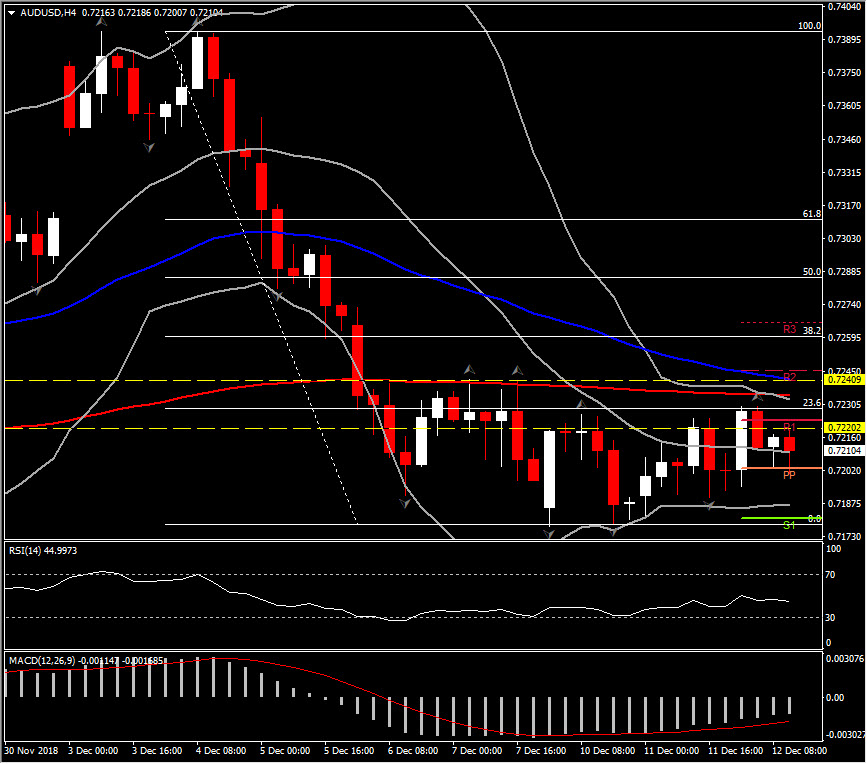
AUDUSD for instance, despite the rebound seen on Monday and the 3-day bullish movement, it is struggling to surpass the 0.7230 level, which is the confluence of 50-day SMA and the 23.6% Fib. retracement level of the downleg from 0.7393 to 0.7177. As the pair managed to recover less than 23.6% of last week’s losses, the overall picture remains negative, with momentum indicators confirming this view as well. RSI is consolidating around 47, reflecting a neutral to negative picture, whilst MACD is sloping below signal line, suggesting an increase of the bearish bias.
Meanwhile, if we zoom in, into the short term and the 4-hour chart, the pair is forming high lows for the past 9 sessions, while it is trading within the upper Bollinger Bands pattern. Hence, today, the retest of the latest up fractals and 50-period EMA is possible, at 0.7240. Support is set at the round 0.7200 level.
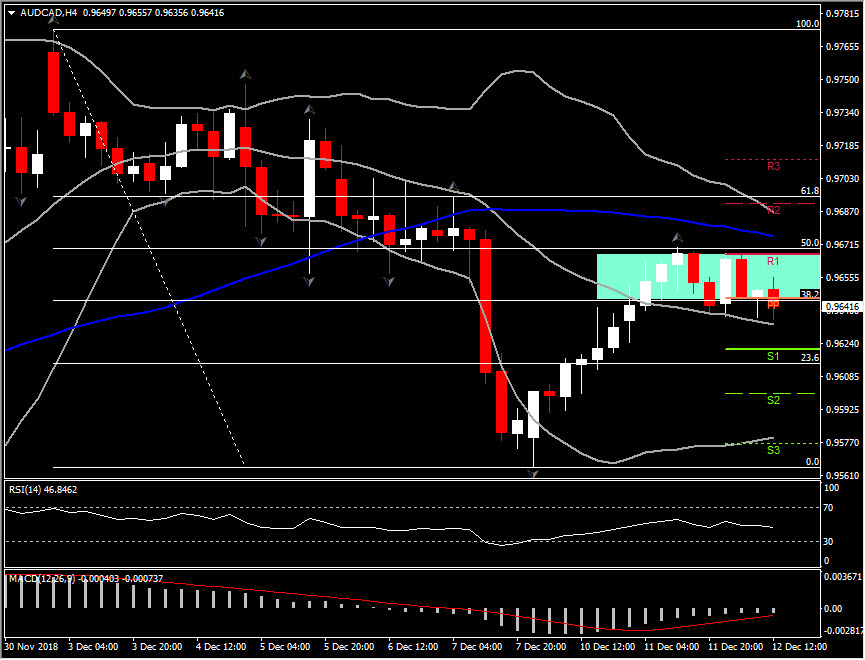
AUDCADpresents similar action to AUDUSD, as the pair moves within a ranging market for the 2nd day, failing to break the 0.9670 level. As the particular level represents the 50% Fib. level on December 3 decline and R1 from day’s PP analysis, the overlap of this level is significant and could drive the pair to the round 0.9700 level or even to November’s peak. Overall, AUDCAD is trading in an uptrend since October, with long-term momentum remaining above neutral zone. Therefore, a closing above 20- and 200-day SMA today, would imply the continuation to the upside.
However, as AUDCAD moves southwards intraday, the immediate Support stands at yesterday’s low at 0.9624. If the pair breaches Support, the next downside hurdle to watch holds at the 0.9580-0.9590 area.
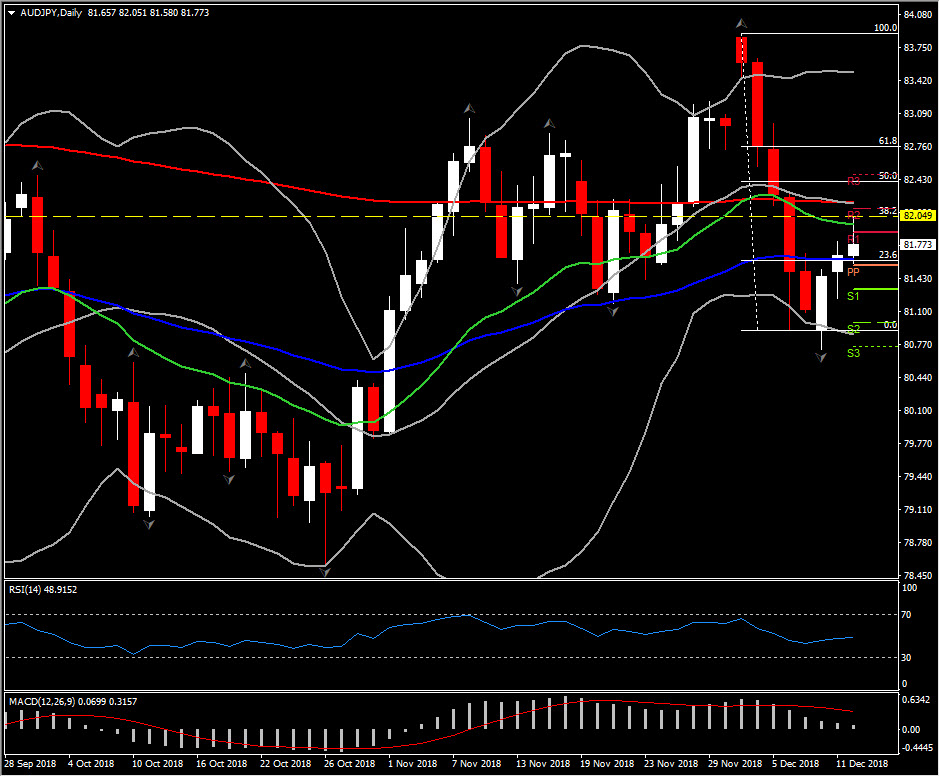
AUDJPY has concurrently printed a 5-day high, as Yen saw safe haven premium unwind. The weakness in the Japanese currency has been concomitant with a revival in risk appetite amid encouraging signs of potential progress in US-China trade relations. Although a theme of Yen underperformance lifted AUDJPY, the rejection earlier of the 38.2% Fib. level set since 83.89 high, at 82.05 level, pushed the pair close to the 81.60 area, which represents yesterday’s along with 50-day EMA and 23.6% Fib. level as well.
Hence, intraday, the pair seems to be affected by bearish bias. The intraday technical indicators, meanwhile, present a negative to neutral outlook, with RSI at 49 and MACD just a breath below neutral zone. If the market rebounds from immediate Support at 81.60, it could retest the 82.00 hurdle again, while a strong closure today above 82.00 could drive the asset to 82.70. Oppositely, intraday, if the pair remains to the downside, a slip below the 81.55, could turn the attention towards Monday’s lows (80.70-80.90 area).
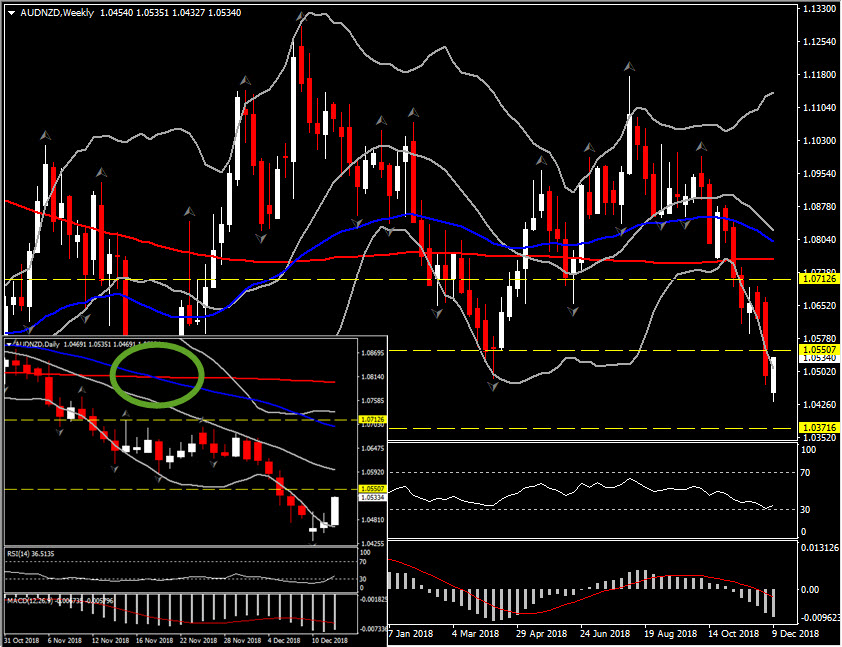
AUDnzdperked up today at 4-day area, however, oppositely with the other Aussie crosses, AUDNZD holds an extremely strong bearish outlook in the long term since August, breaching 8 month’s low. The rejection of 1.1170 peak on August, drove the price below April’s low and very close to 2-year’s bottom, i.e. 1.03 area.
Despite the sharp rally today by nearly 57 pips, the overall negative picture holds as it is traded well below 20-, 50- and 200-day SMA. Meanwhile, the death cross confirmed in the daily chart on November 28, added further pressure to the downside for AUDNZD. Intraday, next immediate Resistance is set at 1.0540 and Support at 1.0510.
Click here to access the HotForex Economic calendar
Andria Pichidi
Market Analyst
HotForex
Disclaimer: This material is provided as a general marketing communication for information purposes only and does not constitute an independent investment research. Nothing in this communication contains, or should be considered as containing, an investment advice or an investment recommendation or a solicitation for the purpose of buying or selling of any financial instrument. All information provided is gathered from reputable sources and any information containing an indication of past performance is not a guarantee or reliable indicator of future performance. Users acknowledge that any investment in FX and CFDs products is characterized by a certain degree of uncertainty and that any investment of this nature involves a high level of risk for which the users are solely responsible and liable. We assume no liability for any loss arising from any investment made based on the information provided in this communication. This communication must not be reproduced or further distributed without our prior written permission.


