This is the first of a two series post on Moving Averages. In this post, we introduce the notion of moving averages and then elaborate on how to compare their performance.
To begin with, Moving Averages (MAs) employ past price movements, usually the closing price, in order to smooth out any one-off erratic behaviour or unexpected/unexplained volatility (noise, as it also known) so that the user can see the trend more clearly. Put simply, a moving average simply averages the last values in a sequence of prices, depending on the length we choose. For example, a 9-period moving average would average the values of the last 9 periods, while a 20-period moving average would average the values of the last 20 periods.
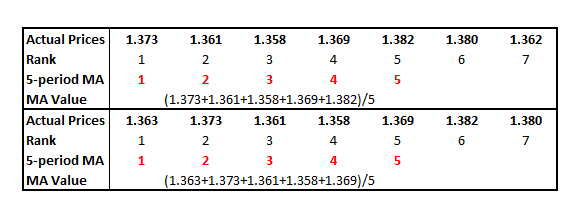
The following table presents a short example of how a moving average works. The first box shows what the moving average value would have been at that specific point time. Notice that I am using a 5-period moving average in this example, which means that I am using the average of the last 5 prices of the currency pair (EURUSD in this case). Then, in the following box, we see that as another day elapsed, a new price came up (1.363), which pushed everything one position to the right. This means that the previous day’s price at rank #5 (1.382) has moved to rank number #6 and we will thus not use it in the calculation of the 5-period MA. This would mean that every period the price which was previously at number #5 will be scrapped, while a new price will enter at #1.
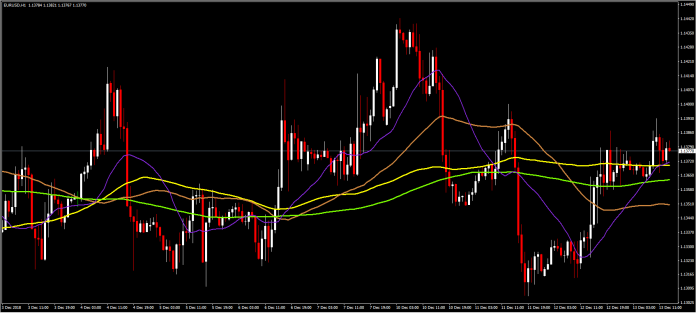
The analysis above is not limited to the 5-period case, but can be extended to any MA, from the fastest 3-period one to the longer-run 200-period MA. The difference between short- and long-term moving averages mainly lies in what we seek to study. As expected, the longer-term MAs tend to show us the longer-term trend, while short-term MAs allow for the examination of shorter-term movements in the price. Mathematically, this makes sense given that a new price in a 5-period moving average would receive a weight of 1/5, which is much bigger than 1/200 in the case of a 200-period moving average. A good example of short- and long-term moving averages can be seen in the first image of this post.
In particular, we see that the shorter-term MA (purple line), specified to have 20 periods, moves much faster than the longer-term MAs. As it appears, the 200-period MA (green line) and the 100-period MA (yellow line) tend to move much more slowly to changes in the price. The orange line, depicting the 50-period MA, moves in-between shorter and longer MAs. Naturally, other MAs also exist, with any possible number of periods being up for use.
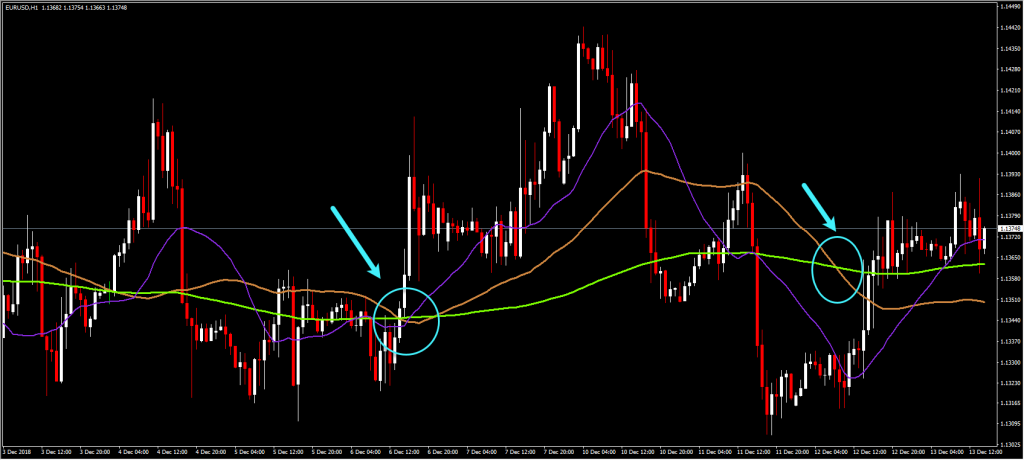
To begin with, notice how using just long-term MAs would be pointless: the 200-period MA and the 100-period MA cross just once in 1-hour chart, with the cross not providing any meaningful sign as the two move more or less in parallel. In essence, what we would really like is for shorter-term MAs to cross longer-term MAs. For example, the 50-period MA, in combination with the 200-period MA issue much better signals in this chart. As the 50-period MA crosses the 200-period MA from below a sell sign is issued. The sign, in retrospect or backtesting if you prefer, appears to be correct, even though the sell sign issued later on does not work as expected. In particular, it appears that the sell sign would come too late, given that we would have already experienced losses at that point.
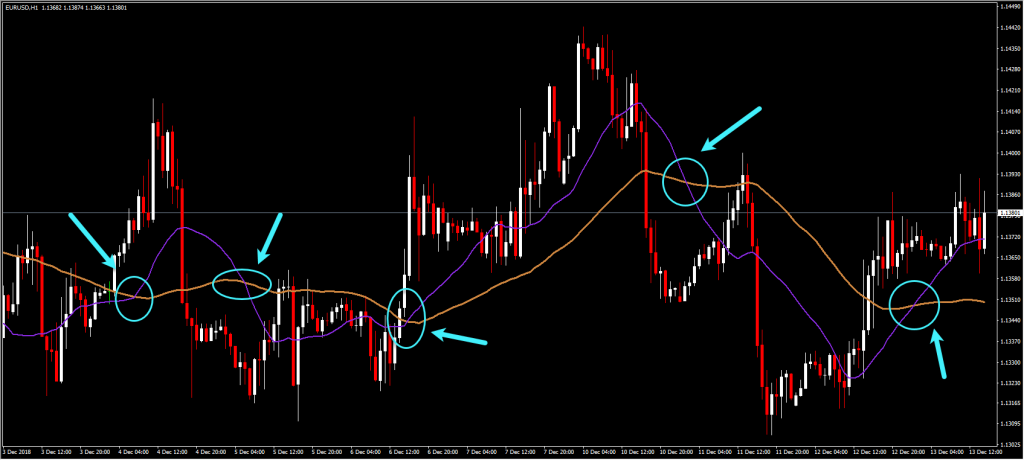
On the other hand, the 20-period moving average and the 50-period MA appear to work much better. As the picture suggests, the signals issued appear to be much more accurate, regarding the ongoing trend. Naturally, the signs do not provide support as to where the trading target should be, but we will leave that as a topic for a future post. Also note that the same MAs which offer good guidance for the 1-hour chart may prove problematic if employed at a different frequency.
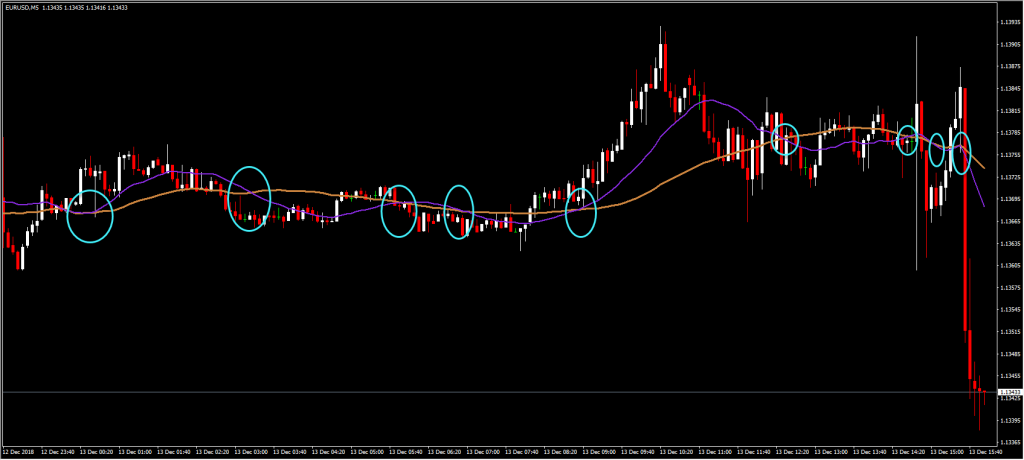
The following chart illustrates the same two moving averages may not work so well for the 5-minute chart. The indicators, while correct for the larger movement in the middle of the chart, show too many false crossing signs which would lead to losses. This is most likely because the frequency is too high for the averages to reach proper levels. As such, one should remember that we need to backtest our moving average selection before committing ourselves to a trade. Thus, in the second part we will deal with shorter-term MAs and have a look as to how these can be used for other frequencies.
Click here to access the HotForex Economic Calendar
Dr Nektarios Michail
Market Analyst
HotForex
Disclaimer: This material is provided as a general marketing communication for information purposes only and does not constitute an independent investment research. Nothing in this communication contains, or should be considered as containing, an investment advice or an investment recommendation or a solicitation for the purpose of buying or selling of any financial instrument. All information provided is gathered from reputable sources and any information containing an indication of past performance is not a guarantee or reliable indicator of future performance. Users acknowledge that any investment in FX and CFDs products is characterized by a certain degree of uncertainty and that any investment of this nature involves a high level of risk for which the users are solely responsible and liable. We assume no liability for any loss arising from any investment made based on the information provided in this communication. This communication must not be reproduced or further distributed without our prior written permission.


