Central banks have spooked markets recently with their hawkish rhetoric. Verbal interventions, which were routinely and intensively carried out by bankers, managed to silence the bustle of the stock market. The market has been told that inflation is no longer temporary. Central Banks are racing to do QT and a number of rate hikes to tame inflation, while wage growth is also out of balance with inflation. Higher interest rates and inflation cause investors to discount the future profits of businesses more, giving them a lower present value today. This means investors are unwilling to pay sky-high valuations for a losing company.
The Covid lockdown in China and the Eastern European conflict, with all the dynamics of sanctions and boycotts, hurt supply chains even more and led to rising inflation figures. Inflation is likely to remain high, meaning global central banks will need to continue quantitative tightening and raise interest rates. This is bad for stock growth globally, especially with the threat of a recession.
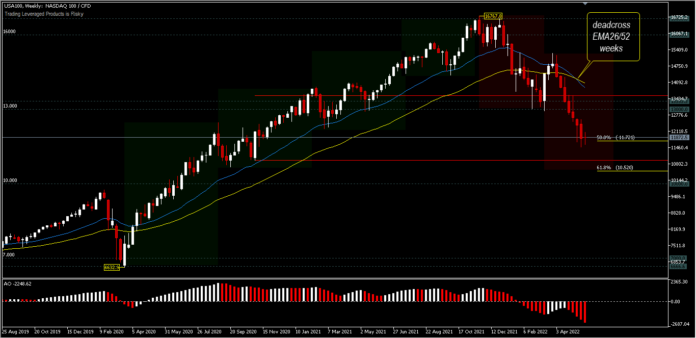
The USA100 index has fallen more than 30% from its 2021 peak (16,767), and there is currently no certainty as to where the next continuation will go, but what is certain is that the current correction position has reached 50.0% FR and is technically in bear market territory. The share prices of the 6 companies with the highest market capitalization that support this index were recorded to have dramatic decline at the end of Q4 2021 and into Q1 and Q2:
- Apple, with the largest market cap of $2,288T, is down 27% from its January peak.
- Microsoft, with a market cap of $1,967T, is down 29%.
- Alphabet, with a market cap of $1,395T, is down 32%.
- Amazon, with a market cap of $1,094T, is down 45%.
- Tesla, with a market cap of $688.89B, is down 50%.
- Meta (FB), with a market cap of $527.65B, is down 55%.
While these are big drops, they are substantially better than what other companies have had, with Snap down more than 75%. Other companies like Carvana, Pinterest, Wayfair, Roku, Stitch Fix, Oscar Health, Affirm, Roku, Unity Software and Asana are all down more than 70% from their all-time highs. The sell-off was supported by the 25-day and 50-day moving averages. This indicates that there are more stocks in the red.
Technical Overview
In the weekly chart of USA100, the price is seen forming an A–B–C pattern. This pattern is a common and commonly seen corrective pattern. However, the intersection of the 26-week (1/2 year) and 52-week (1 year) EMAs suggests a large medium-term correction depth. USA100 is currently sitting on a cliff, flirting with bear market territory. What’s unusual is that the sell-off so far has been very orderly and there hasn’t been any panic. It would be very unusual for a bear market to finish without a widespread panic selling extending the final bottom an additional 5-7% lower.
The asset is currently stalled near the 50.0% retracement, and if conditions worsen will test the 61.8% FR (±10,500). Thus, the low is not near and there is a possibility that the index will fall to around $10,000. A move above the resistance level of $12,588 will dampen the bearish view and the outlook will be blurred.
All technical indications are validating the asset’s move, with the 200-day EMA well above 14,000, the Alligator still looking hungry, and Oscillators still diving in the red. As long as the resistance at 13,555 remains intact, the medium term outlook remains bearish.
Click here to access our Economic Calendar
Ady Phangestu
Market Analyst – HF Educational Office – Indonesia
Disclaimer: This material is provided as a general marketing communication for information purposes only and does not constitute an independent investment research. Nothing in this communication contains, or should be considered as containing, an investment advice or an investment recommendation or a solicitation for the purpose of buying or selling of any financial instrument. All information provided is gathered from reputable sources and any information containing an indication of past performance is not a guarantee or reliable indicator of future performance. Users acknowledge that any investment in Leveraged Products is characterized by a certain degree of uncertainty and that any investment of this nature involves a high level of risk for which the users are solely responsible and liable. We assume no liability for any loss arising from any investment made based on the information provided in this communication. This communication must not be reproduced or further distribution.


