US Equities spiked on US open. It seems that optimism continues after earnings from Goldman and Bank of America beat expectations and lifted their shares.
The USA100 bounced 50 points higher on open, USA500 gained 11 points and USA30 is up 100 points. Europe remains stymied with a 0.5% drop on the UK100 and the PM May no confidence vote again underway, while continental bourses are mildly firmer.
Equities seem to have been boosted due to the recent data, as the US December trade price report revealed stronger than expected core import prices. There was a big food export price pop, though we still saw petroleum-led declines of 1.0% for import prices and 0.6% for export prices. The food export price rise may reflect both a diminishing hit from prior retaliatory tariffs in China, and the 90 day ceasefire in the US-China trade war, leaving a 2-month bounce that mostly reversed declines from a May peak. Trade prices will continue to be restrained by tariffs going forward. Additionally, the NAHB HMI was also released and was better than expected.
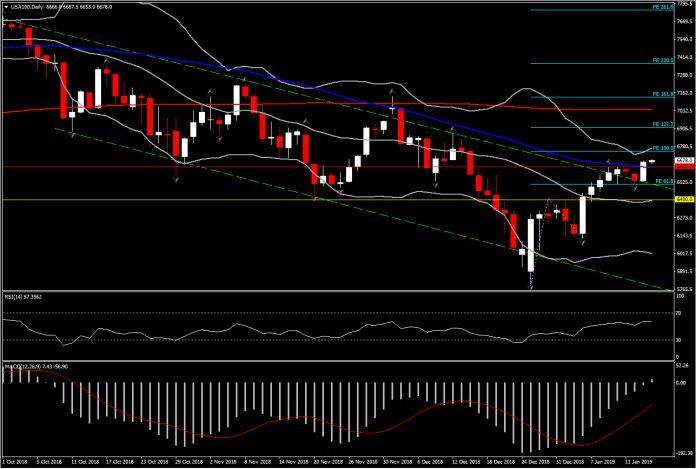
By turning our attention to the technical side of US Equities and the USA100 specifically, we see that positive momentum seems to persist today as well. The price action moved north of the 50-day SMA, the 5-day floor at FE 61.8 from the “V-shaped” rebound on January 4, and the downtrend channel from September. Hence 6,507 Support holds sufficiently so far.
As USA100 spiked 6,724 high on open, its momentum indicators advanced further, with RSI pointing upwards above neutral zone and MACD lines presenting weakness to continue southwards. This is the 4th consecutive positive week for USA100. This, along with the technical aspects, could imply that the recent rally is not done yet and hence further incline should not be a surprise in the near term.
The next Resistance level to be watched is at FE100.0 and the upper Bollinger Band pattern, at 6,750- 6,780. If the asset closes above this area tonight, this would indicate that upside surprise risks are prevailing for now. Further gains above this barrier could reach the level which coincides with FE127.0 , at 6,915.
Click here to access the HotForex Economic Calendar
Andria Pichidi
Market Analyst
HotForex
Disclaimer: This material is provided as a general marketing communication for information purposes only and does not constitute an independent investment research. Nothing in this communication contains, or should be considered as containing, an investment advice or an investment recommendation or a solicitation for the purpose of buying or selling of any financial instrument. All information provided is gathered from reputable sources and any information containing an indication of past performance is not a guarantee or reliable indicator of future performance. Users acknowledge that any investment in FX and CFDs products is characterized by a certain degree of uncertainty and that any investment of this nature involves a high level of risk for which the users are solely responsible and liable. We assume no liability for any loss arising from any investment made based on the information provided in this communication. This communication must not be reproduced or further distributed without our prior written permission.


