


Gold and Silver, Daily & H4
Gold Futures soared to fresh eight-month highs of 1,323.00 from near $1,308, after the dovish FOMC statement, which removed the reference to further gradual rate increases, resulting in a fresh round of risk-on, and a lower Dollar and Treasury yields.
Today marks the fourth straight day of higher daily highs, following the January 18, which provided a Golden Cross as the 50 day moving average moved north of the 200 day moving average (2), while on Friday it broke and breached the key psychological 1,300.00 level. 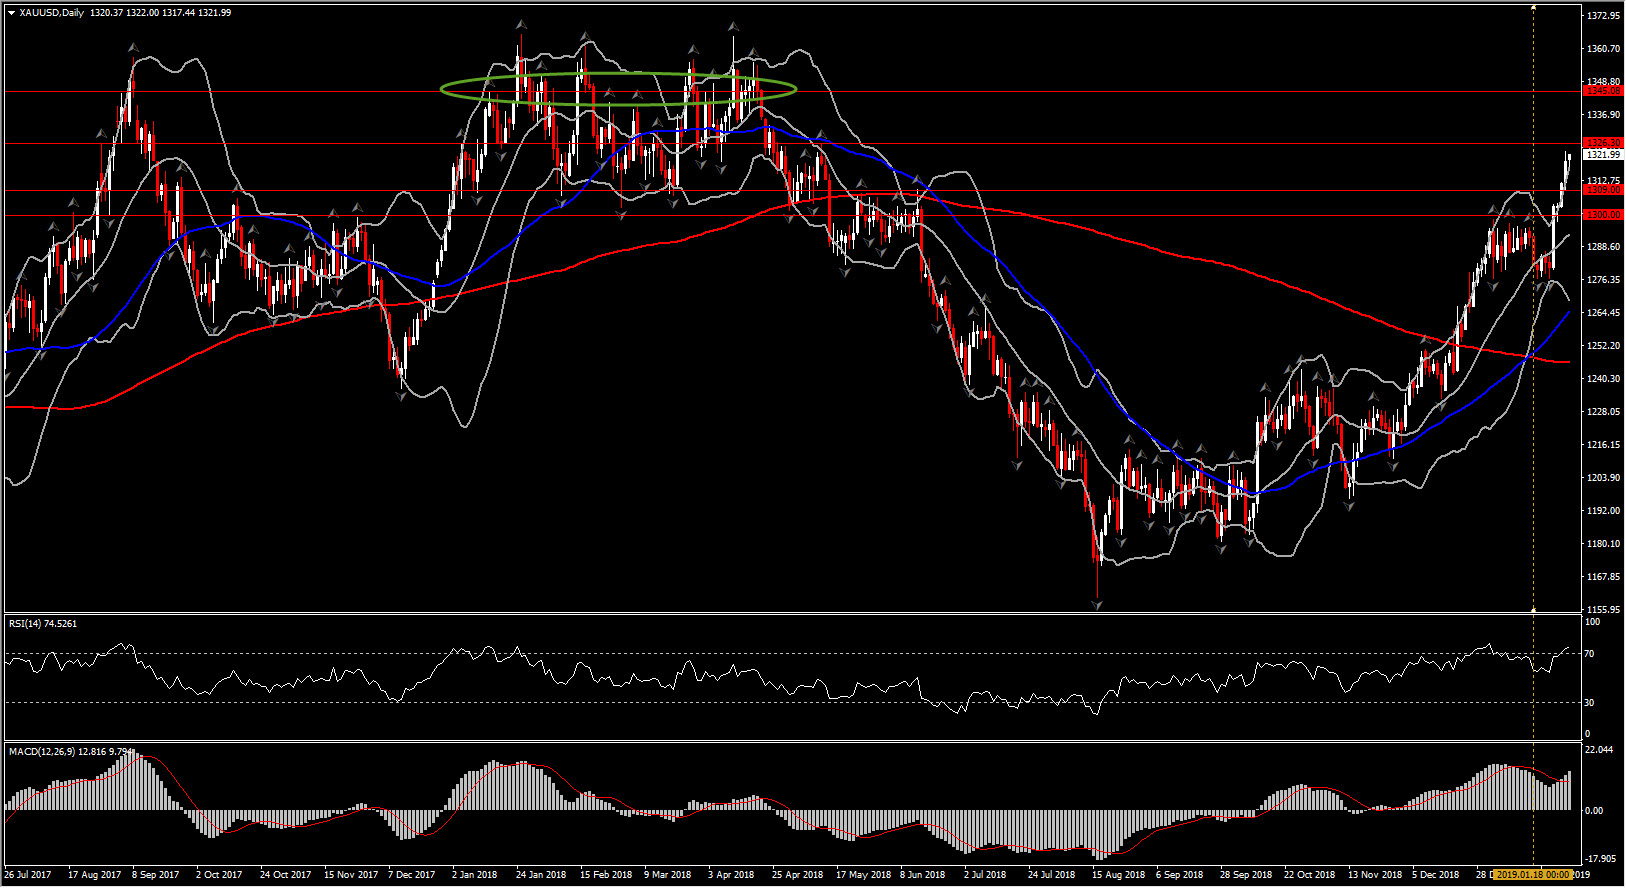
Technically, Gold, is in a strong uptrend and has rallied significantly from the mid of November lows at 1,195.00. The RSI at 74 suggests a possible overbought outlook but the trend remains strong with immediate Support at 1,309.00 (yesterday’s low) and next Support at 1,300.00. MACD oscillator repossess upside momentum by extending above its trigger line. Immediate Resistance comes at 1,326.30, the May 11, 2018 high. Further rally above this barrier could reach 1,345.00 level ( First Resistance during the Q1 2018). The mark of a hummingbird by Bollinger bands pattern, which indicates a bearish signal in the daily chart, could signal some weakness in the near term.
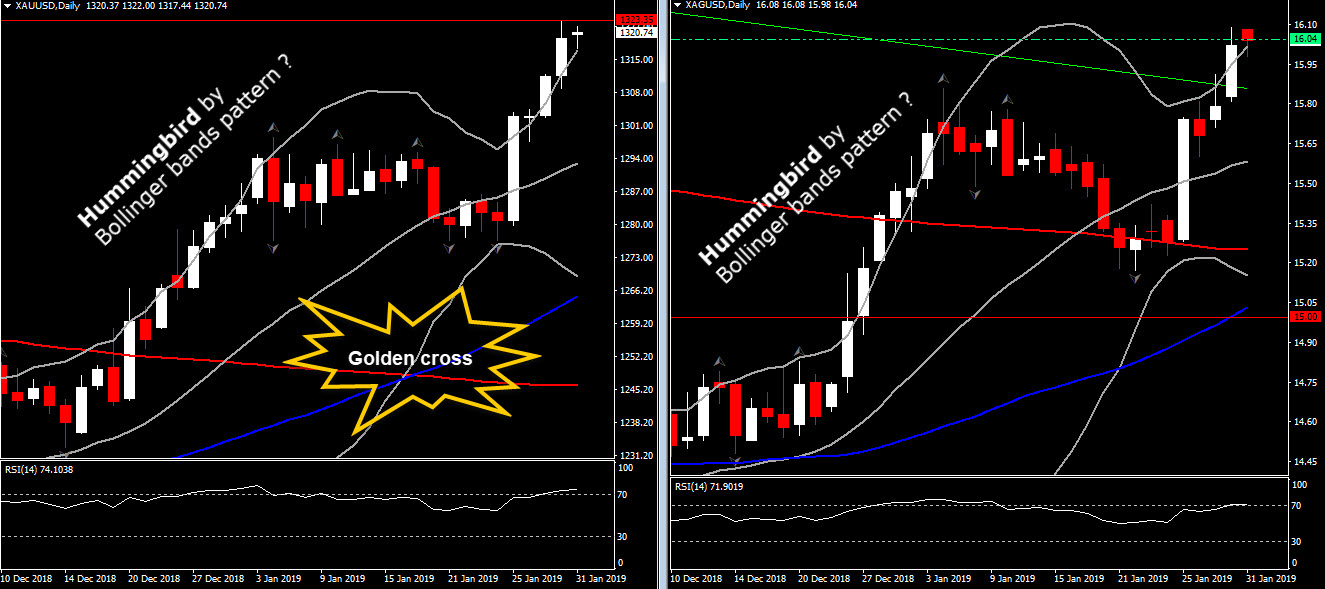
A similar spike has been seen on Silver as well, which ticked up overnight slightly above the $16.00 key level, which acted as a strong Support level in the first half of 2018.
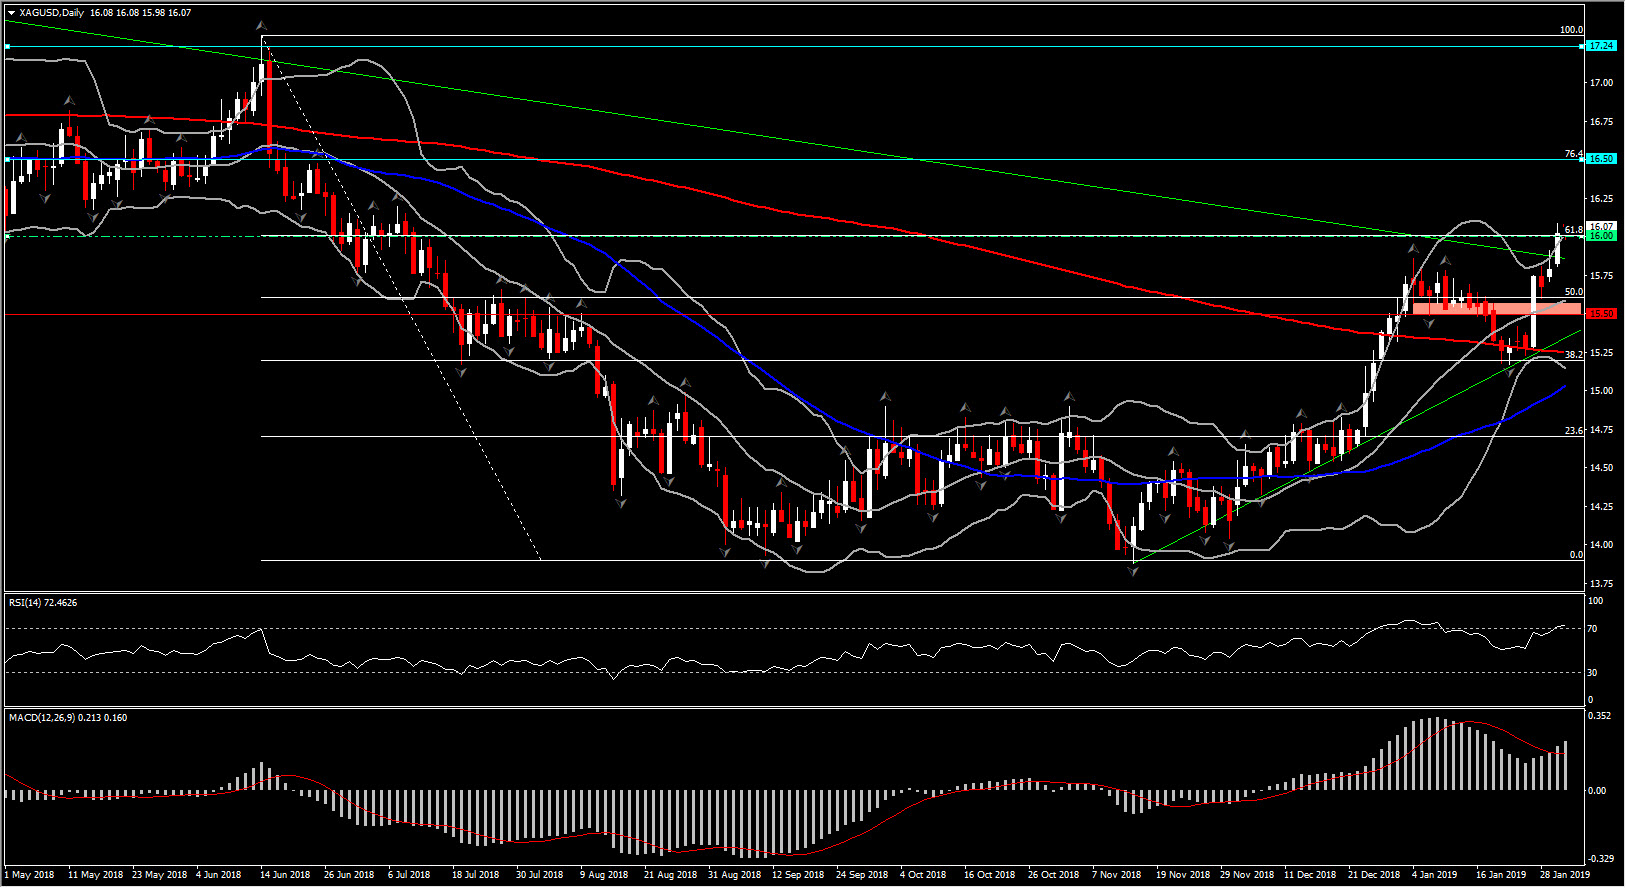
From the technical perspective, Silver recovered more than 60% of the losses seen last year, following a strong movement since the mid of December. It is currently trading decisively above 20- and 50-week SMA, outside the weekly and daily upper Bollinger Bands pattern though, something that implies to an overextended move with possible downside correction in the near future.
Meanwhile, RSI (14-day) at 72 and MACD lines are accelerating higher, suggesting that despite the possibility of downside corrections in the near future, in the bigger picture positive momentum has been refreshed. Hence overall bulls are expected to take benefit from any swings lower, in order to boost the asset price further to the upside.
hence a decisive break of 16.00 level could open the doors to the 76.4% Fib. level from June’s peak, at 16.50. On the breach of this area, the pair could find the next real Resistance at 17.24 hurdle.
In case of short term corrections to the downside, immediate Support stands at 20-day MA and 50% Fib. level at around 15.50-15.60.
Click here to access the Economic Calendar
Andria Pichidi
Market Analyst
Disclaimer: This material is provided as a general marketing communication for information purposes only and does not constitute an independent investment research. Nothing in this communication contains, or should be considered as containing, an investment advice or an investment recommendation or a solicitation for the purpose of buying or selling of any financial instrument. All information provided is gathered from reputable sources and any information containing an indication of past performance is not a guarantee or reliable indicator of future performance. Users acknowledge that any investment in FX and CFDs products is characterized by a certain degree of uncertainty and that any investment of this nature involves a high level of risk for which the users are solely responsible and liable. We assume no liability for any loss arising from any investment made based on the information provided in this communication. This communication must not be reproduced or further distributed without our prior written permission.


