AUDJPY, H4 and Dailly
In the past 2 days the biggest mover by far has been Aussie, which plummeted by over 1.3%. The losses were sparked by RBA Governor Lowe, who seemed to walk back his post-policy meeting statement of yesterday, which disappointed markets by failing to follow the Fed’s dovish turn. During a speech in Sydney earlier today, Lowe corrected this by stating that “over the past year, the next-move-is-up scenarios were more likely than the next-move-is-down scenarios. Today, the probabilities appear to be more evenly balanced.”
This chimed with the prevailing sentiment in Australian markets, where narratives are focused on the risks of a slowing Chinese economy, the recent depreciation of the Australian Dollar (Australian exports being largely priced in US Dollars), and tumbling property prices.
The Aussie Dollar is the day’s outperformer, registering a 1.3% advance vs the Greenback and a 1.8% rise against Yen.
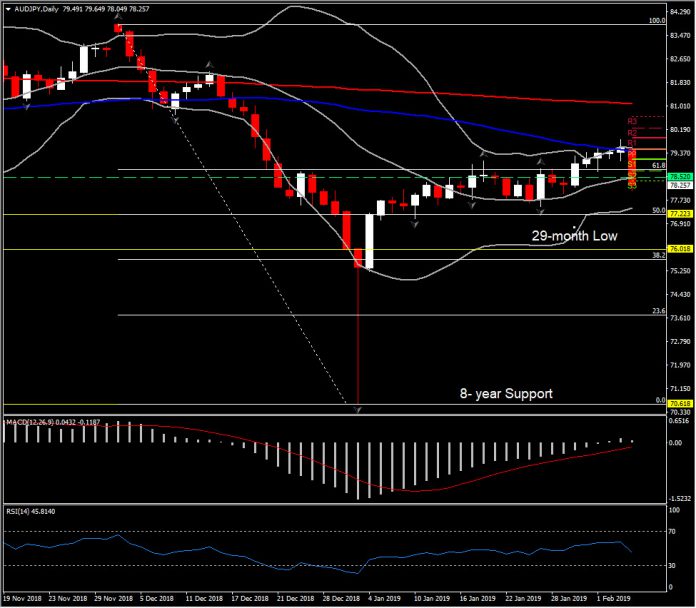
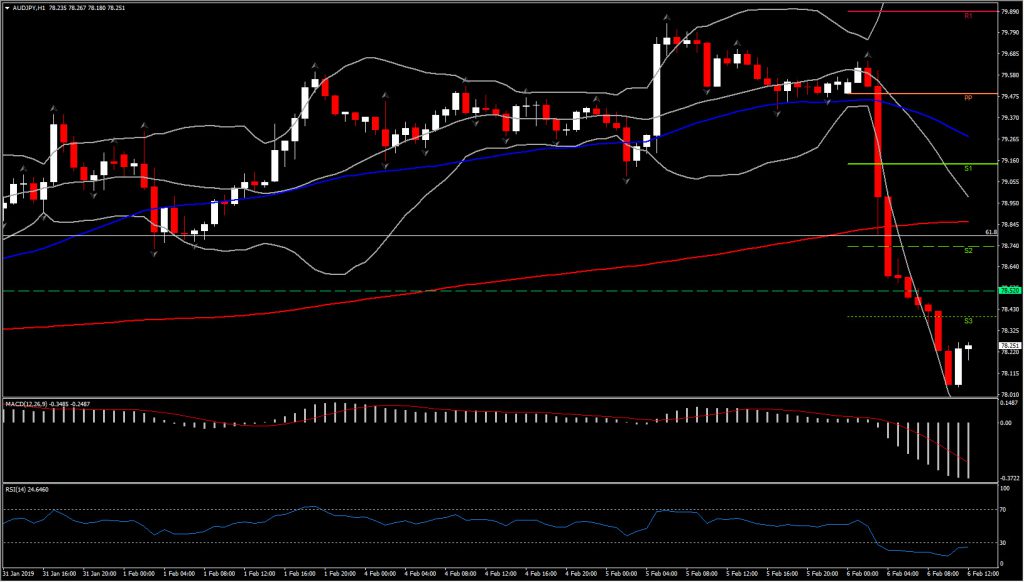
The AUDJPY’s decisive southwards move today, away from 50-day SMA and into the lower daily Bollinger Bands pattern, raises expectations for a new sell off in the medium term. Overall, AUDJPY has been in a downchannel since September 2017, with weak corrections to the upside providing market participants sell opportunities.
The preservation of negative bias in the long term can be also confirmed by momentum indicators, with RSI continually sloping negatively below neutral zone, while on the other hand MACD posted a bearish cross in the medium term but a consolidation sign in the daily timeframe.
Looking at AUDJPY intraday (4-hour chart), the downwards move seems overstretched (oversold technical indicators, price outside Bollinger bands), implying a small U-turn in the hourly chart. However as mentioned above, the pair has been encroached by a strong bearish momentum. Therefore after the break of October’s low which coincides with the 20 DMA, at 78.50, the next level to be watched is the 77.20 (50% Fib. level and January’s Support).
If the pair breaks the latter, there isn’t much else to stop the pair from falling back towards the 76.00 level (29-month low) and the 38.2% fib level at 75.60. On the flipside, Resistance can be found at 78.80, which acted as Resistance for nearly for the whole January, but it is also set at the 61.8% fib. level and the S2 of the day.
Click here to access the Economic Calendar
Andria Pichidi
Market Analyst
Disclaimer: This material is provided as a general marketing communication for information purposes only and does not constitute an independent investment research. Nothing in this communication contains, or should be considered as containing, an investment advice or an investment recommendation or a solicitation for the purpose of buying or selling of any financial instrument. All information provided is gathered from reputable sources and any information containing an indication of past performance is not a guarantee or reliable indicator of future performance. Users acknowledge that any investment in FX and CFDs products is characterized by a certain degree of uncertainty and that any investment of this nature involves a high level of risk for which the users are solely responsible and liable. We assume no liability for any loss arising from any investment made based on the information provided in this communication. This communication must not be reproduced or further distributed without our prior written permission.


