Semiconductor, software and wireless technology multinational QUALCOMM, which has a market cap of $174.563 billion, will report earnings results for the fiscal quarter ending June 2022, following market close on Wednesday, July 27, 2022. Qualcomm expects to post earnings of $2.86 per share for the quarter and the company has set its Q3 EPS guidance between $2.75-2.95. As well as Qualcomm, this week Microsoft, Alphabet, Meta Platforms, Apple, Amazon and others will also report their earnings.

In the previous quarter’s earnings report, on April 27; Qualcomm’s revenue was $11.16 billion, representing a +40.7% year-on-year change. EPS was $3.21 for the same period compared to $1.90 last year. The company’s net margin is 28.42% and the return on equity is 103.73%. The same quarter a year earlier, the business earned $1.59 EPS.
The company recently disclosed its quarterly dividend, which will be paid out on Thursday, September 22. Investors listed on Thursday, September 1 will be awarded a $0.75 dividend. The ex-dividend date of this dividend is Wednesday, August 31. This is a dividend of $3.00 on an annual basis and a yield of 2.04%. QUALCOMM’s current dividend payout ratio (DPR) is 30.71%.
Based on the Zacks Consensus Forecast for the June quarter, revenue is pegged at $10.881 million, representing a 35% growth from last year’s quarterly reported figure. The consensus estimate for adjusted earnings per share is $2.86, which represents a 48.9% increase. Qualcomm is rated Zacks rank #3 (Hold).
Qualcomm shares jumped nearly 10% at the end of April, when it reported accelerating revenue and sales growth. Overall chip sales jumped 52% year over year, but licensing revenue fell 2% to $1.58 billion. Qualcomm still gets most of its revenue from the handset chip business. The company’s RF front-end business, which provides technology enabling 5G connections, generated $1.16 billion in revenue, up 28% from last year’s period.
Technical Overview
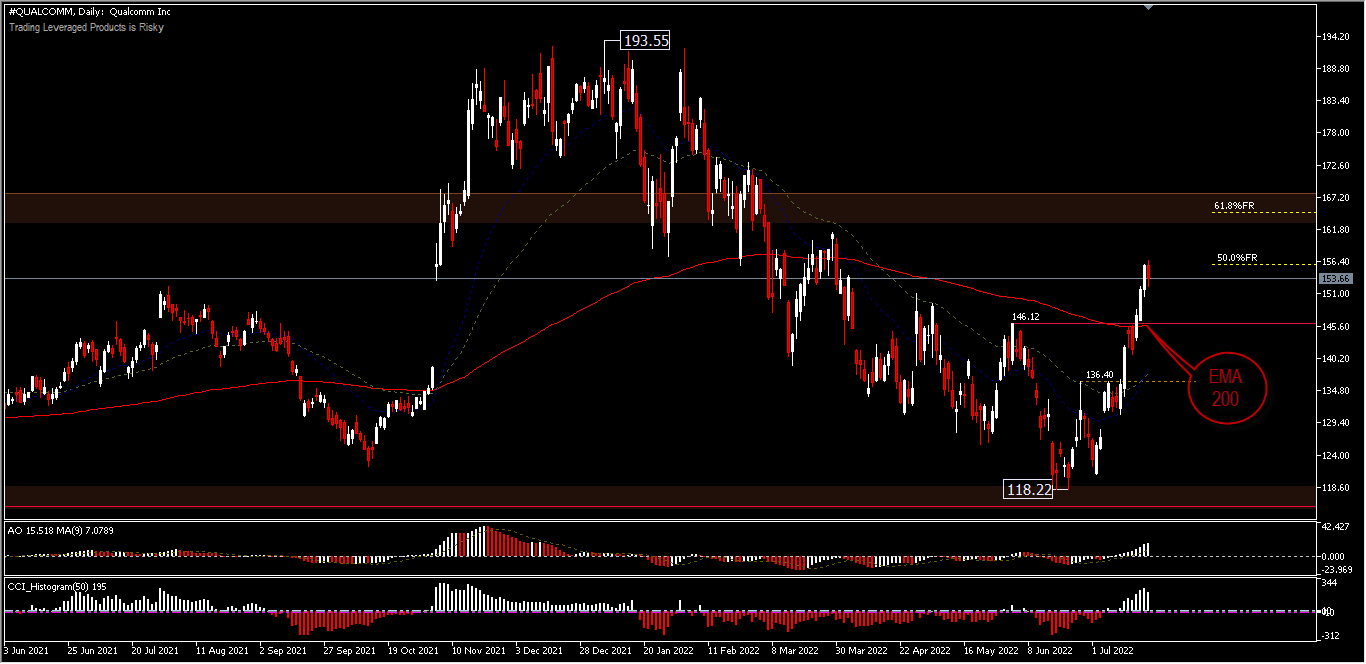
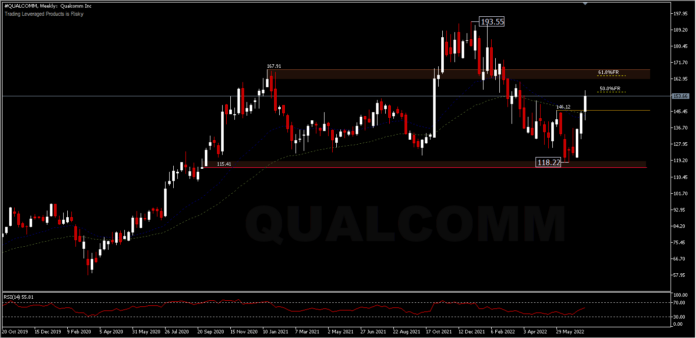
Qualcomm shares have surged from lows along with many other semiconductor stocks, helping the Nasdaq composite lift above its 50-day moving average. Qualcomm posted its third straight week of gains, moving above its 52-week moving average, and closed the week at 153.66 after hitting the 50.0% retracement level of its 193.55 peak and 118.22 low. The positive sentiment around chip stocks was boosted by the $52 billion chip bill running through the Senate. This is a bipartisan bill that essentially subsidizes domestic chip production.

From a daily technical point of view, the asset has moved beyond its 200-day moving average and the oscillations are still showing positive momentum. A break of the 146.12 resistance has confirmed a short term bottoming at 118.22. A further move to the upside would test the 61.8% retracement level adjacent to the 167.91 resistance formed in January 2021, before moving higher. While on the negative side, the support at 146.12 should hold the decline, so that the asset could return to move up. However, if this level is broken, the price bias will return to the downside and cancel the rally scenario. Next support is at 136.40 and a low of 118.22.

A number of research analysts recently issued reports on Qualcomm shares. KeyCorp raised their target price on the stock from $200.00 to $220.00. Tigress Financial raised their target price from $195.00 to $238.00. Morgan Stanley raised its target price from $167.00 to $170.00. According to data from MarketBeat, QUALCOMM has an average rating of “Medium Buys” and a consensus target price of $194.69. Meanwhile, Tipranks sources, based on 20 Wall Street analysts who offered 12-month price targets for Qualcomm in the last 3 months, give an average price target at $190.65 with a high estimate of $250.00 and a low estimate of $135.00. The average price target represents a 24.04% change from the last price of $153.70.
Click here to access our Economic Calendar
Ady Phangestu
Market Analyst – HF Educational Office – Indonesia
Disclaimer: This material is provided as a general marketing communication for information purposes only and does not constitute an independent investment research. Nothing in this communication contains, or should be considered as containing, an investment advice or an investment recommendation or a solicitation for the purpose of buying or selling of any financial instrument. All information provided is gathered from reputable sources and any information containing an indication of past performance is not a guarantee or reliable indicator of future performance. Users acknowledge that any investment in Leveraged Products is characterized by a certain degree of uncertainty and that any investment of this nature involves a high level of risk for which the users are solely responsible and liable. We assume no liability for any loss arising from any investment made based on the information provided in this communication. This communication must not be reproduced or further distributed without our prior written permission.


