Natural Gas and Crude Oil are mainly used for the same purposes, that is, as transportation fuels, as raw materials for the production of electricity, and as raw material for the production of plastics. If this holds then, fundamentally, the only difference between the price of Oil and the price of Natural Gas would be their thermal difference, i.e. how much fuel you could get from a specified quantity for a given price.
Overall, the difference between the thermal value of Oil and the thermal value of Gas stands at 5.7, i.e. purchasing a barrel of Oil would mean that you would receive 5.7 more power than by purchasing a million thermal units of Natural Gas, which is the size of the standard instrument traded. However, Crude Oil also has the advantage of being able to be more cheaply used as fuel, which makes it more attractive, especially in developing economies. In addition, the fixed cost of moving from Oil to Natural Gas can be quite large and, as such, Oil may be preferred by refineries. As such, instead of the expected 5.7-fold difference, a higher spread between Crude Oil and Natural Gas can be expected.
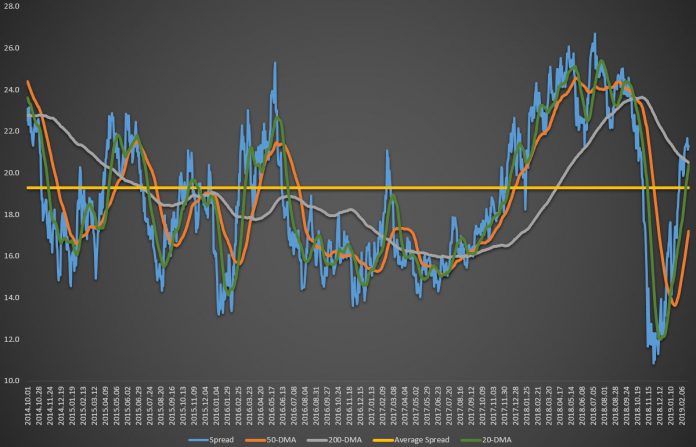
The graph at the top of this post illustrates the spread from 2013 (blue line), using daily data. As the reader may observe, the spread fluctuated from a high of about 28 to a low of approximately 11. Interestingly, and in contrast to having to identify both the spread and the direction of the Oil market, as in our earlier post, this case is easier: if the spread moves above its long-term average value (yellow line), then this should signal that Natural Gas is overbought and its price should decline. However, the indicator is far from perfect, as the spread may continue to rise for a while before returning to its average.
To account for this, we also employ the 20DMA (green line) and the 50DMA (orange line), which should provide for better signals. Overall, as is usually the case, once the 20DMA crosses the 50DMA from below, we take this to be a buy signal; the opposite should be a sell signal. A good example on how this works can be found towards the end of the sample, where the green line crosses the orange one and remains below it until early 2019. The sharp drop in the spread was the result of a rise in the price of Gas compared to the price of Oil. Riskier traders could also short Oil as they simultaneously go long on Natural Gas, even though it should be borne in mind that the possibility exists that both could rise, albeit the second one rises faster.
Overall, the spread between the price of Oil and the price of Natural Gas can provide important indications as to the future value of the two instruments. Like with any strategy, traders need to first test and examine whether they can use it in their trading plan, as well as use proper risk management tools.
Click here to access the Economic Calendar
Dr Nektarios Michail
Market Analyst
Disclaimer: This material is provided as a general marketing communication for information purposes only and does not constitute an independent investment research. Nothing in this communication contains, or should be considered as containing, an investment advice or an investment recommendation or a solicitation for the purpose of buying or selling of any financial instrument. All information provided is gathered from reputable sources and any information containing an indication of past performance is not a guarantee or reliable indicator of future performance. Users acknowledge that any investment in FX and CFDs products is characterized by a certain degree of uncertainty and that any investment of this nature involves a high level of risk for which the users are solely responsible and liable. We assume no liability for any loss arising from any investment made based on the information provided in this communication. This communication must not be reproduced or further distributed without our prior written permission.


