


Gold Action: Futures have continued their losing ways, touching fresh one-plus month lows of $1,282.00, and extending their streak of lower daily lows to 8 sessions. A report from the WSJ that the US and China are on target for a trade agreement by the end of this month has underpinned stocks and commodities globally. The WSJ report is bolstering hopes, however the cautious optimism has been overshadowed by worries over the US growth outlook and an unwinding in trade optimism as the US continues to threaten the re-imposition of tariffs if talks stall or an agreement is not reached on hot button issues.
Overall, the hopes for a US-China trade deal and the risk-on trades weighed on Gold prices, as has additional Dollar strength, with the DXY at a seven-session high. The next Support level is at $1,275.00, slightly below January’s Support, and at the confluence of the 50- and 200-day moving average, at $1,266.00.
It seems that the inverse correlation between Gold and the trade-weighted US Dollar is coming back to life again, despite what we have seen the last few months. As the value of the US Dollar increases, Gold turns more expensive in other currencies, hence fewer buyers entering the gold market, i.e. demand recedes. This was likely a consequence of the risk-on sentiment, which has created selling pressure in the safe-haven asset class in general, with gold losing more than 35% of its 7-month gains.
Currently, gold futures are trading around $1,285, down nearly $8 on the week. For investors to face a move back to the $1,340s again or even higher, a substantial factor is needed such as fresh concerns over global growth slowdown, tighter financial conditions, geopolitical uncertainties etc.
So far, the impressive rally the last few months has come as global growth prospects remain subject to a high level of uncertainty, given the shortage of economic reports since the US government shutdown, and evidence of big declines in global trade volumes that are rippling through market forecasts for growth in Asia and Europe.
Meanwhile, uncertainty over the Brexit path continues to cast a pall over Europe, though risks of a hard Brexit appear to be on the wane. As for the Fed policy outlook, the dovish tone from the January FOMC was very supportive of the precious metal gains so far. Last week’s, steady-as-he-goes testimony on monetary policy from Fed chair Powell, however, did little to inspire gold buyers.
Even though, the Chairman’s testimony was consistent with no change in rates, the stocks boost was the negative driver for Gold prices. Even if there is a popular notion that low/steady interest rates could be good for gold price, there is actually little solid correlation between interest rates and gold prices, at just 28% since 1970.
It is actually the stock market rather than the gold market that is typically affected by interest rates changes. Hence, the recent boost in stock markets seems to be generally underpinning gold.
Looking beyond the Fed’s impact on Gold, the growing Global demand by several sources has benefited gold so far. Gold demand has been seen rising in Asia recently, while interestingly another source of demand is Central banks, as Russia and China have been diversifying away from US dollar reserves and boosting the share of gold in their foreign reserves.
The World Gold Council estimated a 74% year-over-year increase in this “official sector demand” in 2018, while its chief market strategist mentioned that: “reserve asset managers at central banks recognize that they have a very high proportion of their foreign reserves is held in US dollars. If you are looking for an alternative to the US Dollar then I think gold looks more attractive than it did 10 or 15 years ago”.
As for the economic data side, Gold took a dive on Thursday, following the stronger US GDP and Chicago PMI print, despite the overall growth weakness seen globally. Meanwhile , the weak US construction data yesterday weren’t sufficient to boost Gold northwards, as the main focus is triggered by Friday’s NFP data.
The widely expected February US Payrolls could add downside risk to the US Dollar as they are anticipated to rise to 170k, after a 304k January surge. Overall, the outlook for job growth remains strong as the payroll gains are expected to average 206k in 2019.
The downside risks are seen from the weather, some unwinding of robust December and January gains, high claims, and weak producer sentiment employment gauges.
Regardless of a possible slump in US economic data, or scenarios for a possible US recession by 2020, dovish FED or even the trade talks progress, what actually triggers the focus on GOLD is its “breakup” from the USDIndex, as mentioned above.
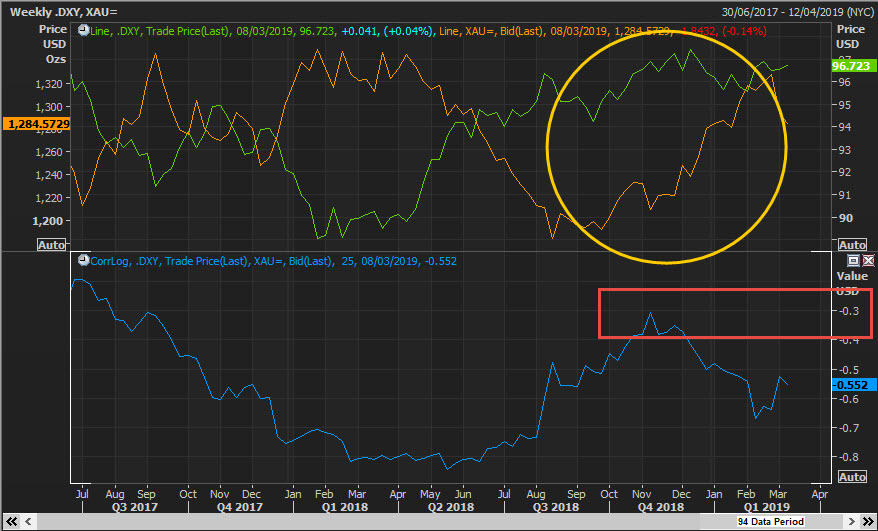
The usual negative correlation between the two assets seems to have returned in the last week. By having inverse correlation back, potentially Greenback appreciation could give Gold life and vice versa, as USD is the benchmark pricing mechanism for the price of gold globally.
However as recently proven, we must have in mind that gold’s investors could support gold for reasons other than Dollar performance.
Technical Outlook
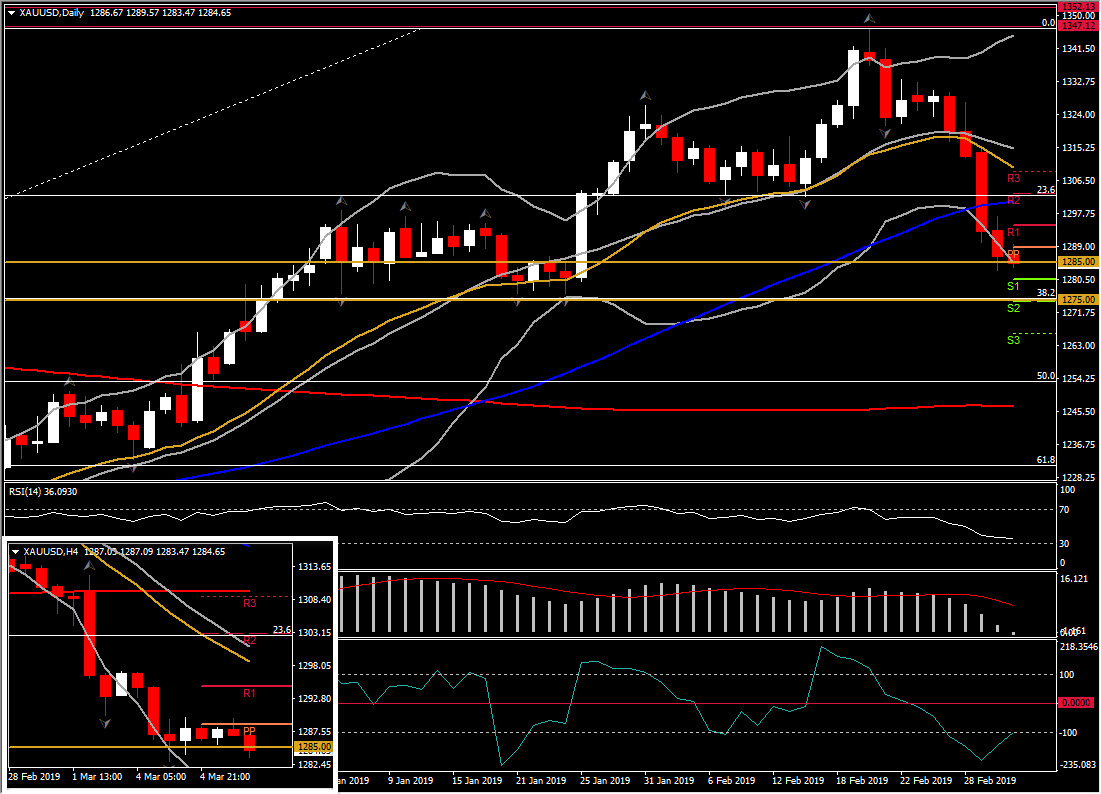
While outflows from the yellow metal picked up in the last 2 weeks, deviating gold from its traditional safe-haven role, the medium picture of the asset remains positive, rendering the pullback a corrective move of the overbought commodity. This is based on the fact that Gold price holds above the 200-day SMA and the 50% Fib. of the reversal at the 2018 low of 1160. Additionally 20-week SMA bullishly crossed the 50-week SMA, confirming the overall bullish view.
If the bears manage to reach and break that area too, that would shift the outlook back to negative.
In the more near-term picture, the Bollinger Bands’ expansion southwards with price moving below them, strengthens the bearish bias in the short term.
The daily momentum indicators are presenting increasing bearish sentiment for XAUUSD, with RSI at 36, while MACD supports the negative view by falling below its signal line and nearly zeroing. Oppositely Stochastic looks upwards but this could be explained by due to the intraday consolidation seen so far today around 1,285 level. Intraday indicators are strongly negatively configured in the 4-hour chart, without giving signs of an oversold market yet.
Further declines today, could find initial Support at yesterday’s low at 1,282.80, however the next real Support comes at the 38.2% Fibonacci retracement, at $1,275.00. A drift lower could alert the retest of 1,246-1,250 area (200-day SMA and 50% Fib.)
Immediate resistance would likely come from yesterday’s peak and 23.6% Fibonacci of 1,297 and 1,303. Further resistance could be met at the 20-day SMA at 1,315.
Click here to access the Economic Calendar
Andria Pichidi
Market Analyst
Disclaimer: This material is provided as a general marketing communication for information purposes only and does not constitute an independent investment research. Nothing in this communication contains, or should be considered as containing, an investment advice or an investment recommendation or a solicitation for the purpose of buying or selling of any financial instrument. All information provided is gathered from reputable sources and any information containing an indication of past performance is not a guarantee or reliable indicator of future performance. Users acknowledge that any investment in FX and CFDs products is characterized by a certain degree of uncertainty and that any investment of this nature involves a high level of risk for which the users are solely responsible and liable. We assume no liability for any loss arising from any investment made based on the information provided in this communication. This communication must not be reproduced or further distributed without our prior written permission.


