


AUDNZD
AUDNZD has returned nearly all gains seen yesterday, by turning below 1.0350. While so far the prospect of ongoing support from central banks and governments helped stock markets to move higher across Asia yesterday, today’s trading saw a pullback, with Chinese shares posting moderate losses. As the Australian economy is close to China, Aussie seemed to have benefited from these declines in the stock market.
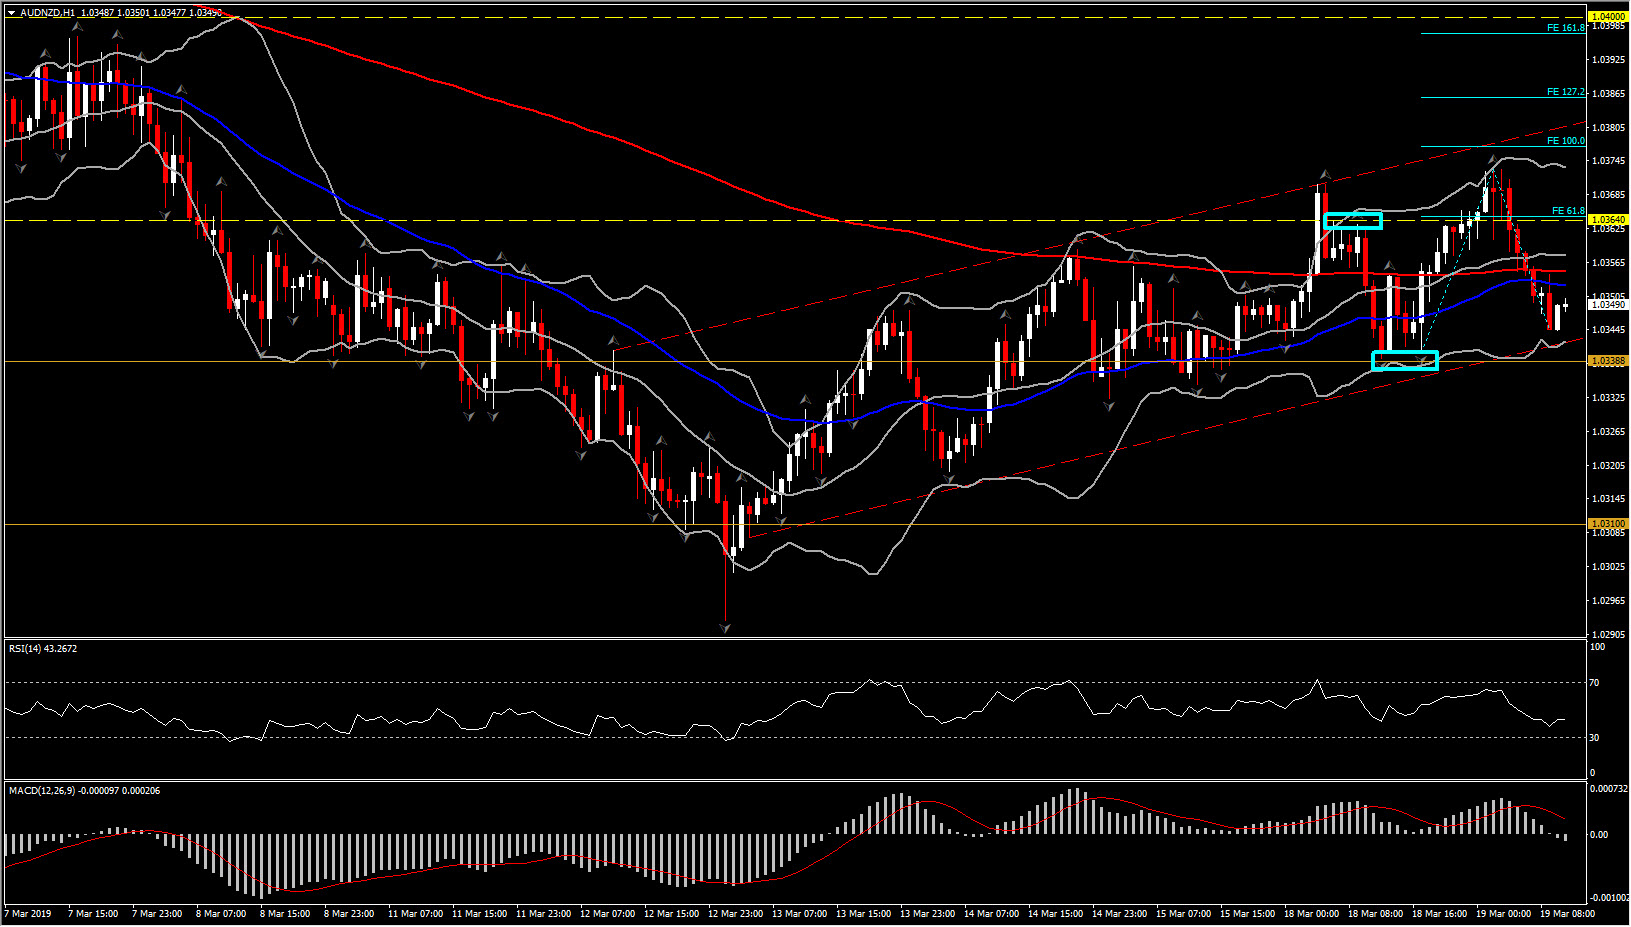
AUDNZD overall has faced major losses since its 1.1174 high in July 2018, by keeping a constant downtrend direction. This negative outlook has not changed in March, as the pair is moving below all 3 daily MAs and significantly as there is a long way to go until the midpoint of this sharp downtrend, or until the pair covers the 38.2% of 6-month drift, at 1.0600.
In the near term however, in the past 4 days AUDNZD grew, by rejecting the 1.0310 bottom and forming an upchannel up to a 1.0373 high, with recorded corrections to the downside providing market participants buy opportunities.
Today, by looking at AUDNZD intraday (H1 and H4) another pullback has been formed, which found Support at 1.0344 level, slightly above the 1.0339 Support which coincides with the lower BB pattern in the hourly chart, latest low Fractal and also the low trendline of the upchannel.
AUDNZD’s decisive southwards move today could raise expectations for a new sell off and the continuation of the overall decline in the medium term, but only if the next leg lower is below the 1.0333 (50% of the gains seen since last Wednesday and lower BB in H4 chart). Such decline along with the preservation of negative bias in the daily to medium term picture could open the way towards last week’s low at 1.0290. Further decline could trigger the attention to 2016’s levels at 1.2630-1.2660.
Daily momentum indicators confirm the overall strong negative momentum with RSI and MACD continually sloping negatively below neutral zone.
On the flipside, if the pair manages to sustain above 1.0333-1.0339 today, along with a confirmed move above the 200-period EMA (H1) at 1.3550 but more precisely above 1.0360 (20-period SMA), this could suggest a retest of the 1.3777 Resistance level in an attempt to continue trading within the short term upchannel. On the break of yesterday’s peak, next Resistance can be found at 1.3860 (127.2 FE) and 1.0400 (March 5 peak and latest daily up fractal).
Click here to access the Economic Calendar
Andria Pichidi
Market Analyst
Disclaimer: This material is provided as a general marketing communication for information purposes only and does not constitute an independent investment research. Nothing in this communication contains, or should be considered as containing, an investment advice or an investment recommendation or a solicitation for the purpose of buying or selling of any financial instrument. All information provided is gathered from reputable sources and any information containing an indication of past performance is not a guarantee or reliable indicator of future performance. Users acknowledge that any investment in FX and CFDs products is characterized by a certain degree of uncertainty and that any investment of this nature involves a high level of risk for which the users are solely responsible and liable. We assume no liability for any loss arising from any investment made based on the information provided in this communication. This communication must not be reproduced or further distributed without our prior written permission.


