The Yen may have bounced back over the past two months, but USDJPY still gained 14% in 2022, which is the worst performance since 2013. The driver behind the yen’s decline was the BoJ’s ultra-loose policy of capping the 10-year yield at 0.25%, which made the US-Japan interest rate gap continue to widen throughout 2022.
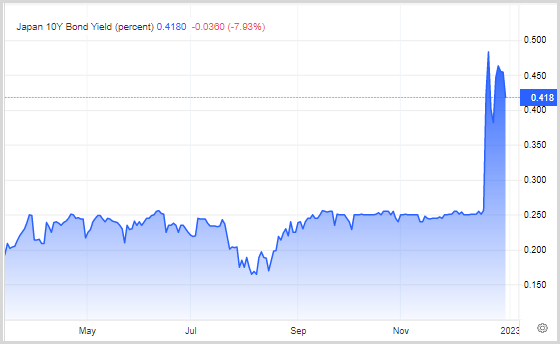
However, the BOJ surprised at the end of 2022 by widening the yield curve from 0.25% to 0.50%. The move sent the Yen sharply higher, and has increased speculation that the BOJ may be planning to exit its massive stimulus programme, although the BoJ denies having any such plans.
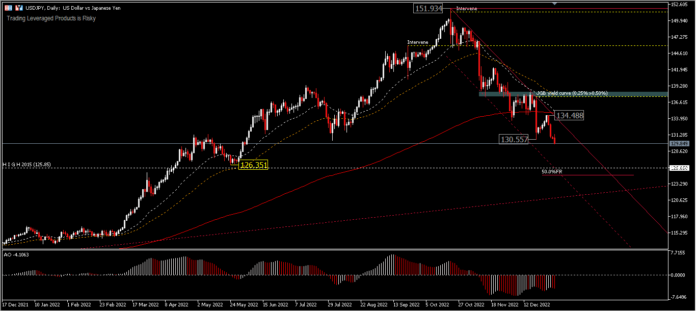
Two interventions, one each in September and October, in addition to the 10th JGB yield widening in December, when the Fed started to successfully cool the inflation temperature and hike path expectations eased slightly, seemed to create the right momentum for the Yen to ease its weakness. This is evident, as the Yen managed to strengthen by 13% from a peak of 151.93.

Meanwhile, Japanese 10-year bond yields were above 0.45% at the end of 2022, near highs not seen since 2015, and hovering around the upper limit of the Bank of Japan’s policy band.
Markets anticipate the BoJ to remain in control until BoJ Governor Kuroda’s term ends in April, after ten years at the helm of the central bank, which makes the BoJ’s actions highly unpredictable. Kuroda has shown that he is not afraid of making decisions at the end of his term. The market will be looking for additional movements that could affect the Japanese Yen in the next meeting on 18 January.
Technical Review
USDJPY – The break of the 130.55 minor support reconfirms that the decline from 151.93 as a corrective wave is not yet complete. The bias is still tilted to the south, with a possibility to test 126.35 support or around 50.0% FR (98.93-151.93 drawdown). While on the upside a move beyond 134.48 could halt the 151.93 corrective wave and bring the price back to the upside of the initial area, before the BoJ unwinds the JGB yield threshold around 137.00.
Although the 134.48 resistance is below the 200-day EMA, which is a strong dynamic resistance, for the time being technical support is still on the bears’ side, as long as trading is done below the MA.
Click here to access our Economic Calendar
Ady Phangestu
Market Analyst – HF Educational Office – Indonesia
Disclaimer: This material is provided as a general marketing communication for information purposes only and does not constitute an independent investment research. Nothing in this communication contains, or should be considered as containing, an investment advice or an investment recommendation or a solicitation for the purpose of buying or selling of any financial instrument. All information provided is gathered from reputable sources and any information containing an indication of past performance is not a guarantee or reliable indicator of future performance. Users acknowledge that any investment in Leveraged Products is characterized by a certain degree of uncertainty and that any investment of this nature involves a high level of risk for which the users are solely responsible and liable. We assume no liability for any loss arising from any investment made based on the information provided in this communication. This communication must not be reproduced or further distributed without our prior written permission.


