


The Australian Dollar outperformed its peers as momentum picked up, after the US Dollar exchange rate fell from recent highs. The GBPAUD pair reached some of its highest levels since December early this week, but slipped from its latest peaks as markets awaited January inflation reports and last quarter’s GDP data this morning.

Australia’s annual inflation rate in January eased, implying the worst of the price increases may be over as the economy absorbs a record run of interest rate hikes. The consumer price index for the month was 7.4%, compared with 8.4% for December alone, the Australian Bureau of Statistics (ABS) said on Wednesday. Economists had been predicting the January CPI would be 8.1%. Meanwhile, most advanced economies reported a decline in inflation for December and this was reiterated by Governor Philip Lowe during his recent testimony to MPs in Canberra.
The economy expanded 0.5% in the December quarter alone, the ABS reported. The decline in inflation and GDP suggests that high interest rates are having the expected effect and slowing economic activity. Hence markets interpreted these results as a reduced risk of higher interest rates.
In general, Australian data has been relatively better lately, with retail sales recovering for January, while last quarter’s current account surplus jumped to reverse most of Q3’s decline. Nonetheless, recent USD strength has delayed AUD gains while commodity sentiment remains fragile amid fears of further monetary tightening by the central bank.
For the RBA, the rise in consumer spending is a sign, that the economy can continue to bear higher rates. The central bank has raised rates about 325 bp since May 2022 in a bid to curb inflation. Interest rates currently stand at 3.35% and the market has priced in a peak rate of 4.3%, with four rate hikes expected before the end of the year. The RBA will meet on March 7 and is expected to raise rates by 25 bp.
Technical Review
GBPAUD fell, after hitting a high of 1.8028 in Tuesday’s trading. Support is seen at 1.7748 and 1.7602 with the H4 RSI seen turning downwards from overbought levels, and the MACD signal line about to cross the histogram in the buy zone. A better report could likely take the pair to test 1.7748 first, while a disappointing report could take the pair to the FE 161.8 projection at 1.8188 (from 1.7387–1.7748 and 1.7602 drawdown), before reaching 1.8273 peak.
Elsewhere, Canada’s December GDP released yesterday recorded 2.3% year-on-year last year, below market expectations of 2.7% and the previous value of 2.8%. The increase in the figure slipped for the seventh consecutive month, while recording the smallest increase since February 2021. Sequentially from the previous month, the data recorded a decline of -0.1%, less than the market expectations of 0% and the previous value of 0.1%. This is also the first time since April 2020 that a decline was recorded.
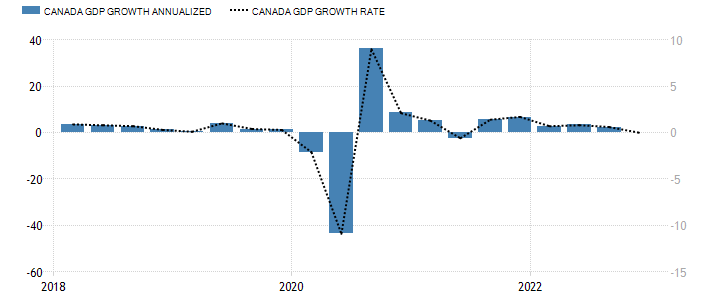
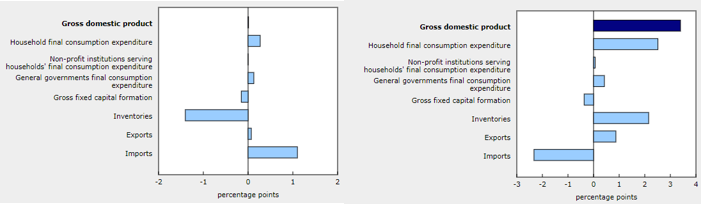
Data from Statistics Canada showed that real GDP was nearly unchanged in the fourth quarter. Subdata show that business machinery and equipment spending declined for the second consecutive quarter (-7.8%); housing investment declined for the third consecutive quarter (-2.3%) – through all of 2022, housing investment fell by a total of more than 11%, largely driven by buyers and homeowners digesting the pace of the Bank of Canada’s interest rate hikes; and household spending recorded an increase of 0.5% (previously -0.1%), mainly due to an increase in spending on durable goods (+3.4%). In particular, spending on new trucks, vans and sport utility vehicles recorded an increase of +10.3%; spending on used vehicles recorded an increase of 7.9%; and spending on new passenger vehicles recorded an increase of 5.8%. In addition, spending on services slowed to 0.3% (previously 1.1%). Overall, household spending increased by a total of 4.8% in 2022. Government spending recorded an increase of 0.1% (previously 0.6%). Finally, net trade improved. In the fourth quarter, exports of goods and services edged up 0.2% (previously 2.6%), while imports declined further by -3.2% (previously -0.4%).
Some economists expect that the Bank of Canada may tell the public in next week’s rate resolution (March 8) that it has “credible evidence that inflation and the economy are slowing” through this data and may pause its interest rate raises as a result.

On the other hand, Australia’s GDP for the full year 2022 recorded growth of 2.7%, in line with market expectations, but well below the 5.9% seen in 2021. Moreover, year-on-year, the figure recorded a growth of 0.5% in the previous quarter, which was less than the market’s expectation of 0.8% and the previous value of 0.6%. This is the fifth consecutive quarter in which the Australian economy has recorded growth, but it is also the weakest growth in the sequence. With the household savings rate falling to its lowest level since the third quarter of 2017 at 4.5% (previously 7.1%), and consumption growth also weakened, recording only 0.3% (1.0% last quarter). In addition, private and public investment underperformed, sliding -1.7% (previously 1.2%) and down -0.7% (previously -3.5%), respectively; government spending rose further to 0.6% (previously 0.2%); and on the trade front, exports grew 1.1% while imports fell -4.3%.
Last month, the Australian Federal Reserve raised its cash rate by 25 basis points to 3.35%. This was the ninth consecutive month of rate hikes for the central bank, which also recorded the largest monetary tightening since 1989, pushing borrowing costs to the highest level since September 2012. The Australian Fed even released a clear signal, stressing that it will still raise interest rates further in the future to counteract the still too high inflation. The committee expects that Australia’s GDP will average between 1% and 2% in 2023 and 2024. Seeing that the current level of GDP is still above this “target”, the probability is that this does not prevent the central bank from doing its job.
Technical Review
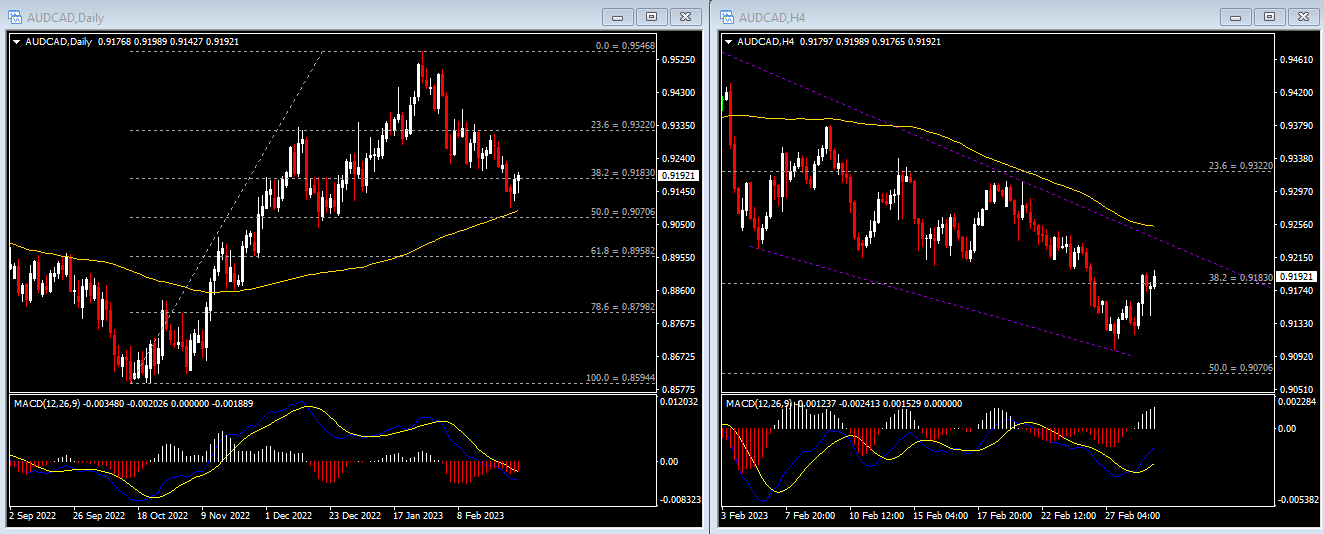
The daily chart shows that the AUDCAD has been trending lower over the past two months. The pair has recently recorded a rally around the 100-day SMA and is currently testing the 0.9180 (FR38.2%) resistance. Today’s first 4-hour candle close shows that long strength still outweighs short strength. Therefore, if the currency pair manages to stabilize above 0.9180, it will further test the top line of the falling wedge, followed by the 100-SMA dynamic resistance seen on the 4-hour, and 0.9320 (FR 23.6%). On the other hand, if the exchange rate falls back below 0.9180, the downtrend could continue and test 0.9070 (FR 50.0%) as well as the psychological level of 0.90.
Click here to access our Economic Calendar
Larince Zhang & Ady Phangestu
Market Analysts – HF Educational Office
Disclaimer: This material is provided as a general marketing communication for information purposes only and does not constitute an independent investment research. Nothing in this communication contains, or should be considered as containing, an investment advice or an investment recommendation or a solicitation for the purpose of buying or selling of any financial instrument. All information provided is gathered from reputable sources and any information containing an indication of past performance is not a guarantee or reliable indicator of future performance. Users acknowledge that any investment in Leveraged Products is characterized by a certain degree of uncertainty and that any investment of this nature involves a high level of risk for which the users are solely responsible and liable. We assume no liability for any loss arising from any investment made based on the information provided in this communication. This communication must not be reproduced or further distributed without our prior written permission.


