


Apple,Inc., an American multinational technology company specializing in the design, manufacture, and sale of smartphones (iPhone), personal computers (Mac), tablets (iPad), wearables and accessories (Apple Watch, AirPods, Apple Beats), TVs (Apple TV) and other varieties of related services (iCloud, digital content stores, streaming, licensing services), shall release its Q2 2023 earnings results on 4th May (Thursday), after market close. What lies ahead for this conglomerate with the largest market capitalization at over $2.6T?
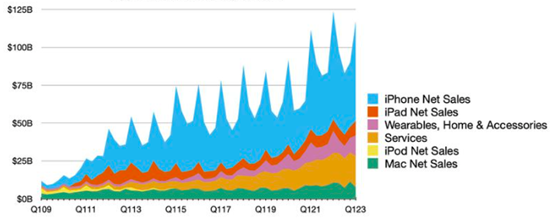 Fig.1: Apple Inc. Revenue by Product Category. Source: MacRumors
In the previous quarter, Apple sales revenue recorded its largest decline since 2016, by over -5% compared to the same period last year. This was also the year-over-year sales decline since 2019. By product category, Mac revenue down the most, -28.66% (y/y) to $7.74B; iPhone revenue down -8.17% (y/y) to $65.78B, mainly impacted by the production issues in China (less likely to happen again as Apple is slowly reducing its manufacturing activity in China); Other Products revenue down -8.3% (y/y) to $13.48B; iPad was the only product category that recorded positive gains, up +29.66% (y/y) to $9.4B; Services revenue was up +6.4% (y/y) to $20.77B. The less-favoured sales result was related to challenging macroeconomic environment and the still-strong Dollar. Net profit was down -13.3% (y/y) to $30B.
On a positive note, Apple Inc marked 2 billion active users on all of its products, up from 1.8 billion as reported in January last year. Consistent improvement in global reach may suggest better monetization from old and new customers through its products and services in the future.
In addition, the company may continue to see more positive breakthrough from its services category, after achieving an all-time revenue record despite the difficult environment. Recently, the company has introduced a payment feature namely Apple Pay Later , which allows its users in the US to split purchases into four payments, with zero interest and no extra fees incurred. Other highlights include multiple payments to different merchants in a single transaction, easy order tracking and secure merchant tokens.
On 17th April, the company announced that it shall work in collaboration with Goldman Sachs in offering Apple Card users a saving account with a 4.15% APY. The rate is said to be higher than the national average by 10 times! Users will be able to easily set up the account, build savings directly and seamlessly, track account balance and interest earned anytime, and even get unlimited daily cash back up to 3%.

Fig.2: Reported Sales of Apple.Inc versus Analyst Forecast. Source: CNN Business
Consensus estimate for sales stood at $92.9B, significantly down -20.73% from the previous quarter, and down -4.52% from the same period last year.

Fig.3: Reported EPS of Apple.Inc versus Analyst Forecast. Source: CNN Business
On the other hand, EPS is expected to reach $1.43, down -23.94% from the previous quarter, and down -5.92% from the same period last year.
The management expressed a pessimistic outlook for the coming quarter, including Mac and iPad sales declining by double digits compared to the same period last year; iPhone sales may also fall but at a less deteriorating rate.
Technical Analysis:

#Apple (AAPL.s) share price pared most of its losses incurred in the latter half of 2022 since gaining ground in early January this year, printing year-low at $124.17 (a level not seen since June 2021). The asset rebound strongly in Q1 2023 and now traded within an ascending wedge pattern. $170 ( FR 78.6%, extended from the high of Jan’22 to the low of Jan’23) and the upper line of the ascending wedge serve as the nearest resistance. A successful break above these levels may lead the bulls to continue testing the high of Q3 last year ($176.14) – $177, followed by the high of Jan ‘22, at $182.87. On the other hand, the bottom line of ascending wedge serves as the nearest support. A break below this line may indicate a halt to the upside momentum, and the share price may test $160.50 (FR 61.8%), followed by $153.50 (FR 50.0%) and the dynamic support 100-day SMA.
Click here to access our Economic Calendar
Larince Zhang
Market Analyst
Disclaimer: This material is provided as a general marketing communication for information purposes only and does not constitute an independent investment research. Nothing in this communication contains, or should be considered as containing, an investment advice or an investment recommendation or a solicitation for the purpose of buying or selling of any financial instrument. All information provided is gathered from reputable sources and any information containing an indication of past performance is not a guarantee or reliable indicator of future performance. Users acknowledge that any investment in Leveraged Products is characterized by a certain degree of uncertainty and that any investment of this nature involves a high level of risk for which the users are solely responsible and liable. We assume no liability for any loss arising from any investment made based on the information provided in this communication. This communication must not be reproduced or further distributed without our prior written permission.


