Among the main beneficiaries of the rally that took place in the equity markets in the last few hours, after optimism grew late Wednesday afternoon about an imminent solution to the debt ceiling impasse, were the US indices, led by the Nasdaq (+1.81%) which rose to 11-month highs. The most surprising indices in yesterday’s session were the DAX (+1.31%) – which at one point climbed to within 100 points of its ATH – and especially the JPN225, which rose to a 33-year high in the 30,900 zone. In addition – in a 2-year view – global indices have returned to outperform US ones after at least 10 years.
Relative Performance, US500 (g) – GER40 (b) – JPN225 (o), 12/21 – Now
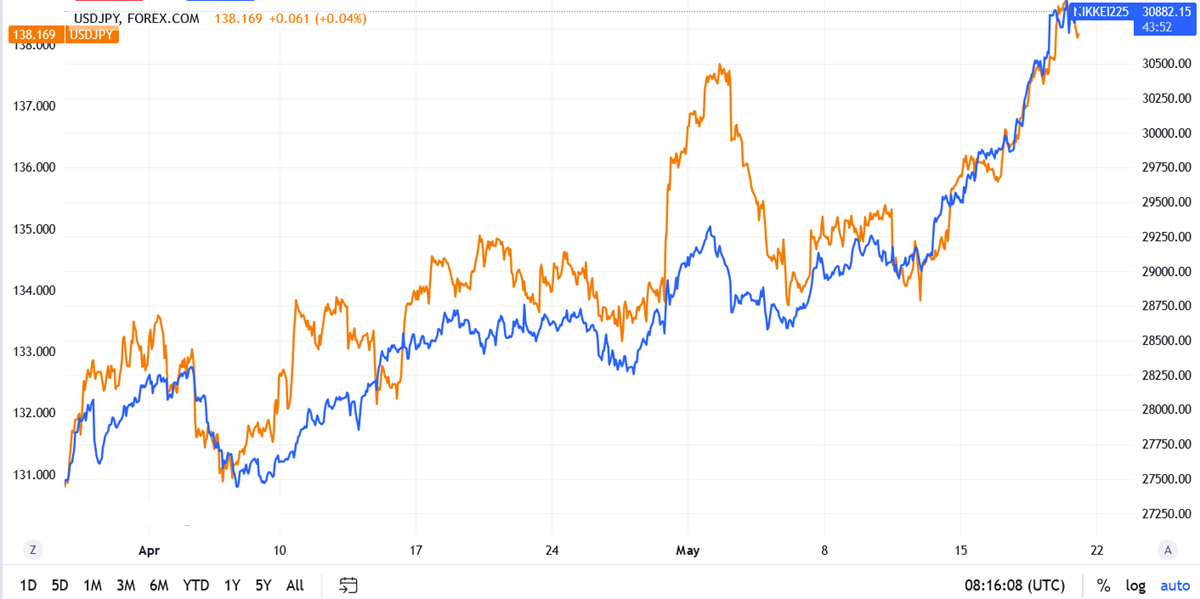
The reasons for the Japanese index’s biggest weekly rally since Nov2022 – that took it up 5.1% from the May 12 close – are not totally clear. Sure, there were some good, better-than-expected GDP data this week, and also the Foreign Investment in Japanese Stocks figure on Thursday morning showed a brisk $808.3 billion increase in flows; the inflation figure of 3.5% y/y also bore witness to a ”hot” economy. There is the anecdotal factor that Warren Buffett, on a visit to the Land of the Rising Sun last month, announced that Berkshire Hathaway had consistently increased its investments in Japan’s five largest trading houses. They are conglomerates with interests in everything from logistics to real estate, frozen foods, aerospace, and newer investments such as EVs and renewable energy and Buffett himself compared them to Japanese Berkshires. When one of the world’s most famous investors expresses his appreciation, the rest of the market listens with interest. Last but not least, the weakness of the Yen against the USD probably helped this recent sprint, as is usually the case. However, there must be some other factors.
Technical Analysis
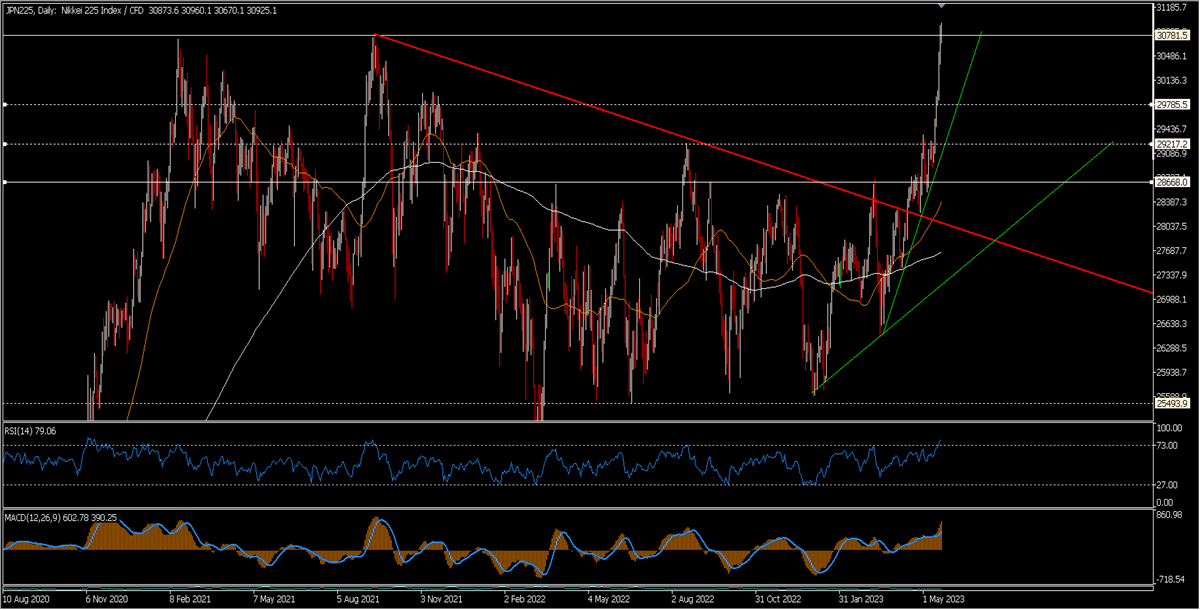
In the following daily chart from 2021 onwards, we can see the previous post-1990 highs, reached in February and November 2021 respectively. We can also see how at the end of March the previous bearish trend was first tested (the price had gone up to 28700), then finally broken with conviction and retested during the last 2 weeks of April. Since then, helped by the upside break of 28.7k, the JPN225 has risen parabolically to the point where the RSI (14) is quite strongly overbought at 78.86. When such a strong movement takes place, very often there can be technical market reasons such as a change in the positioning by mid-term investors above some key levels that triggers the rapid closing of short trades and adds to the strength of the buyers, throwing fuel on the fire.
The 50-day and 200-day moving averages are both positively inclined but indicators are overbought and chasing the price is a risky strategy. A consolidation at these levels is probably to be expected, possibly even a pullback. A first interesting support is in the 30250 area, then there is 29800. The steepest bullish trendline (green) currently passes by 29200 and this level also represents a 38.2% FIB retracement of the rally which started from the lows of 15-16 March. Traders will likely wait for some solid end-of-the day confirmation.
Click here to access our Economic Calendar
Marco Turatti
Market Analyst
Disclaimer: This material is provided as a general marketing communication for information purposes only and does not constitute an independent investment research. Nothing in this communication contains, or should be considered as containing, an investment advice or an investment recommendation or a solicitation for the purpose of buying or selling of any financial instrument. All information provided is gathered from reputable sources and any information containing an indication of past performance is not a guarantee or reliable indicator of future performance. Users acknowledge that any investment in Leveraged Products is characterized by a certain degree of uncertainty and that any investment of this nature involves a high level of risk for which the users are solely responsible and liable. We assume no liability for any loss arising from any investment made based on the information provided in this communication. This communication must not be reproduced or further distributed without our prior written permission.


