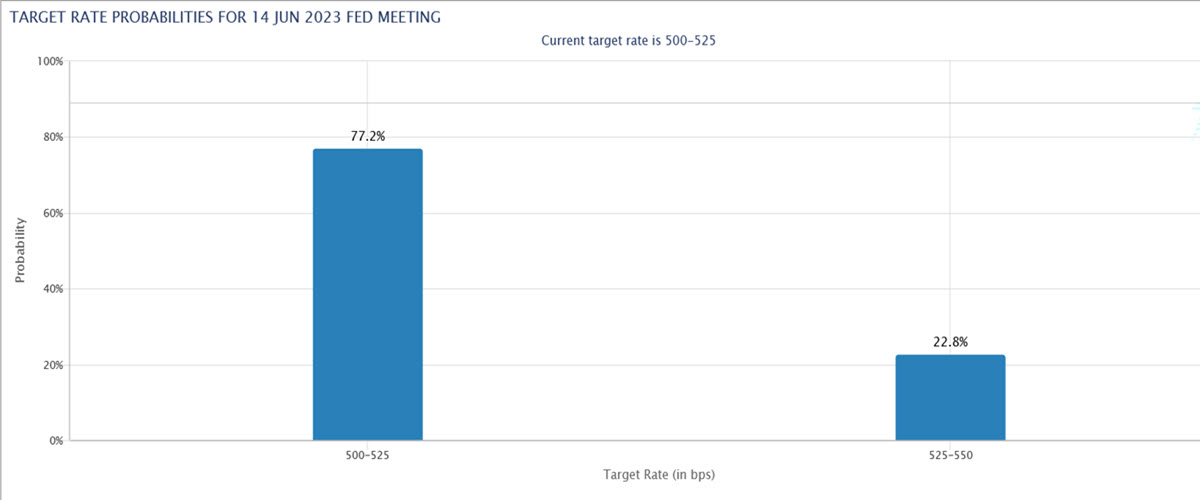
US500 is close to a 10-month high on the back of some dovish Fed speakers, the Debt Ceiling resolution and wonderfully low ISM Manufacturing Paid Prices data yesterday afternoon (44.2, down from 53.2 previously, 52 expected), all of which brought the chances of a Fed pause at the meeting in 12 days’ time to 77%.
Target Rate Probabilities, CME FedWatch Tool
The Volatility Index is hence currently trading at 17.45, not far away from this year’s low at 16.80. Simply explained, the price of buying options to protect against a fall in the price of the main US index is very convenient (for a more comprehensive view on the subject, we suggest you attend our next educational webinar on the subject on Tuesday 06 June). During the whole of 2022, the VIX did not trade below 18: admittedly this was a bit of an exception, since before the Covid shock in 2020 it was very normal to see this Index between 11 and 18. It will be interesting to follow its development over the next few days, also because the next expiry of the future contract – and a possible gap up since the curve is positively inclined – will not occur before Tuesday, 20 June.
Technical Analysis
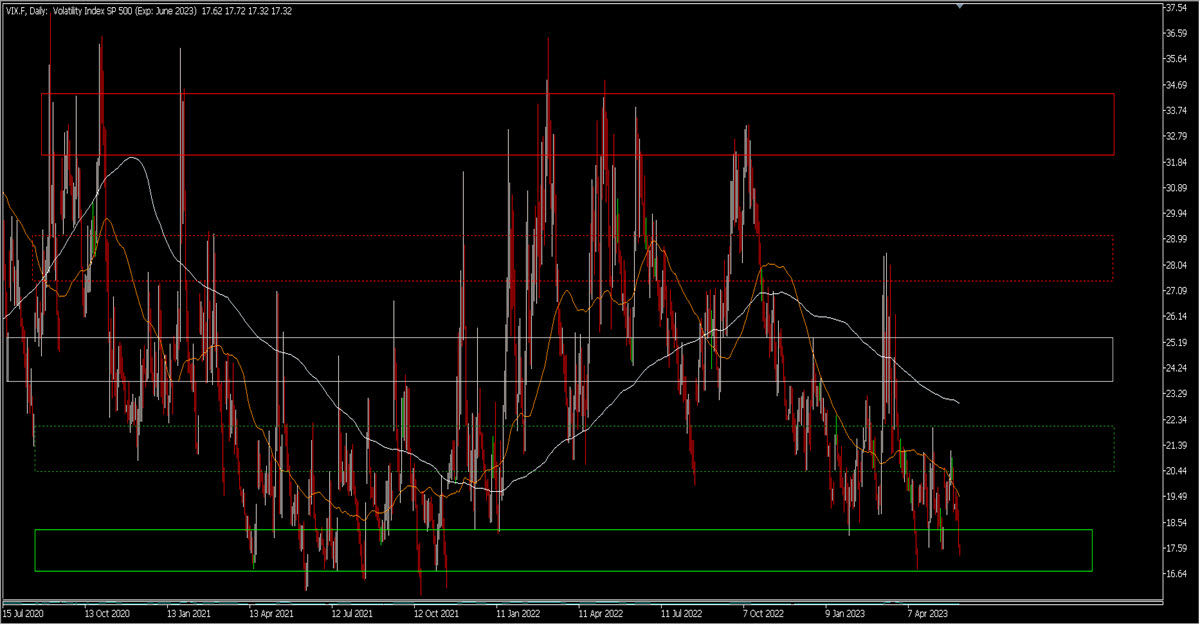
VIX, Daily, 2020 – now
On the daily chart, we see that the price bounced at the beginning of April from just below 17 which is a strong support area and has held as an approximate minimum for about 3 years now. For this type of index I really like to identify static areas, leaving out trends: the green rectangle at the bottom, between 16.75 and 18.30 was where prices found a bottom for the whole of 2021. In the last 2 months, any eventual rally was capped at the next upper zone (green dashed rectangle), in the 20.5-22 area.
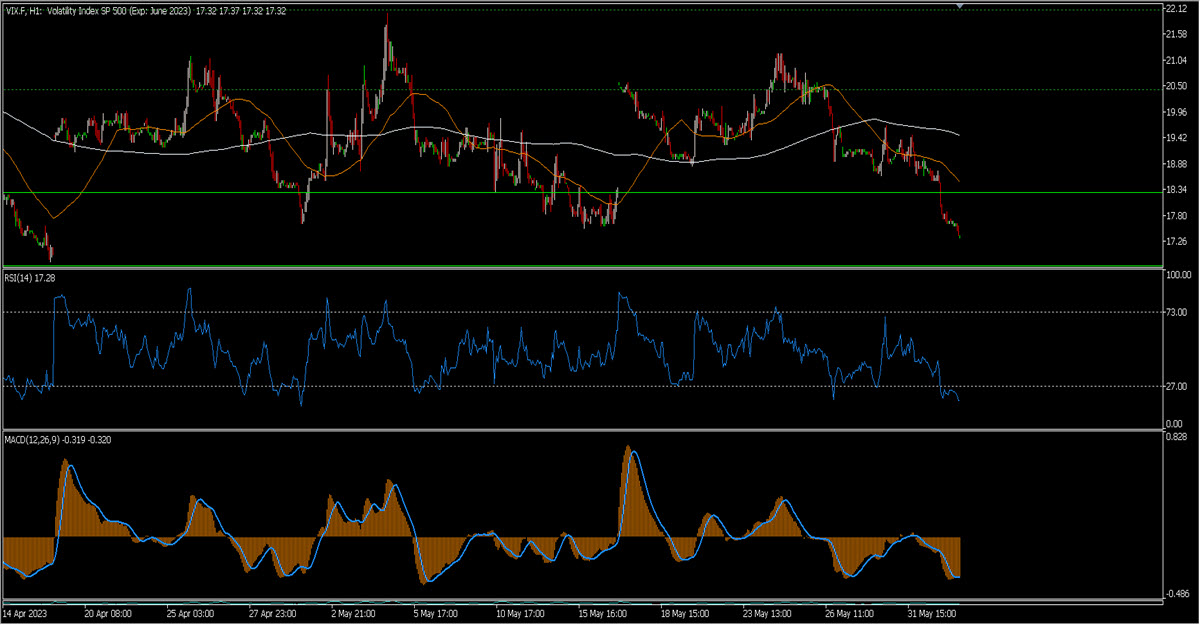
VIX, H1
With this in mind, switching to the H1 chart and focusing on indicators, we can’t help but notice the RSI is deeply oversold and the MACD very negative but slowing down its decrease.
A rise in the VIX from these levels therefore seems not unlikely. The main ”problem” is timing as – as we will see in the abovementioned webinar – this index is as brutal and fast in its upward movements as it is slow and steady in retracing downward (when market makers are selling volatility). But it will certainly be interesting to keep an eye on it now, also in relation to the US500 (to which it is usually inversely correlated).
Click here to access our Economic Calendar
Marco Turatti
Market Analyst
Disclaimer: This material is provided as a general marketing communication for information purposes only and does not constitute an independent investment research. Nothing in this communication contains, or should be considered as containing, an investment advice or an investment recommendation or a solicitation for the purpose of buying or selling of any financial instrument. All information provided is gathered from reputable sources and any information containing an indication of past performance is not a guarantee or reliable indicator of future performance. Users acknowledge that any investment in Leveraged Products is characterized by a certain degree of uncertainty and that any investment of this nature involves a high level of risk for which the users are solely responsible and liable. We assume no liability for any loss arising from any investment made based on the information provided in this communication. This communication must not be reproduced or further distributed without our prior written permission.


