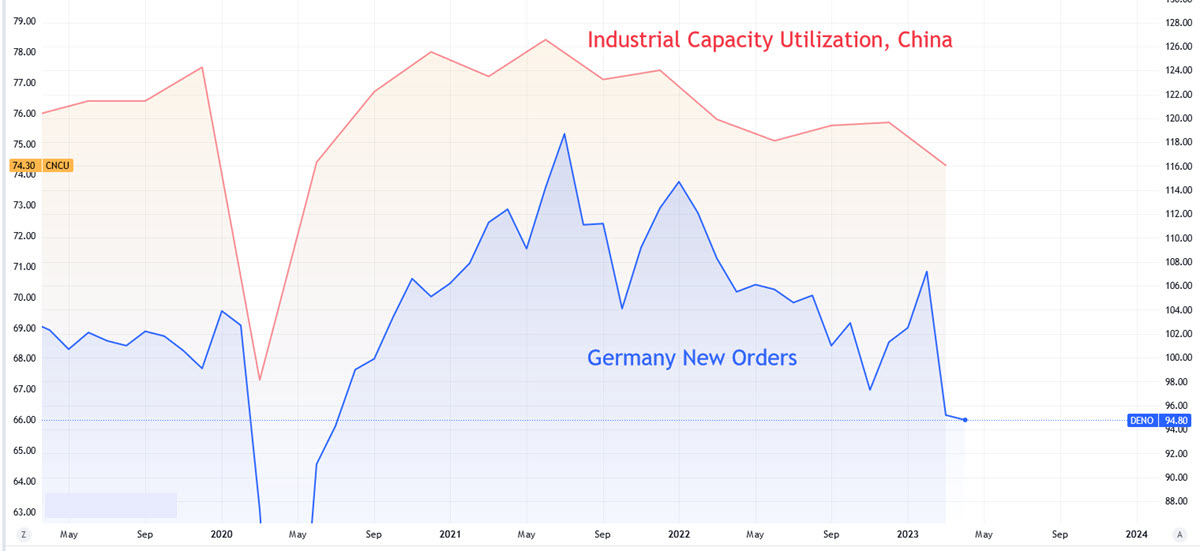
Yesterday morning the German Factory Orders data showed a new slump: -9.9% y/y. And the voices of those who are worrying about a de-industrialisation of the manufacturing giant and (former) locomotive of Europe are getting louder and louder, since the downward trend is clear after 2021. Yes, this has been the trend for at least the past two years, although you will have heard lately how the German model has been based on cheap energy from Russia and therefore more blame has been placed on the current war.
The fact is that Germany is not an isolated case: in the chart below you can see it in relation to Industrial Capacity Utilisation in China (last night exports from the Asian country fell by -7.5%, much more than expected; USD denominated imports fell as well). Looking towards the US, the situation is not much different, with Industrial Production stuck at an anaemic +0.2% y/y. Then again, who hasn’t also noticed that manufacturing PMIs in virtually all advanced economies have been in contractionary territory for months now.
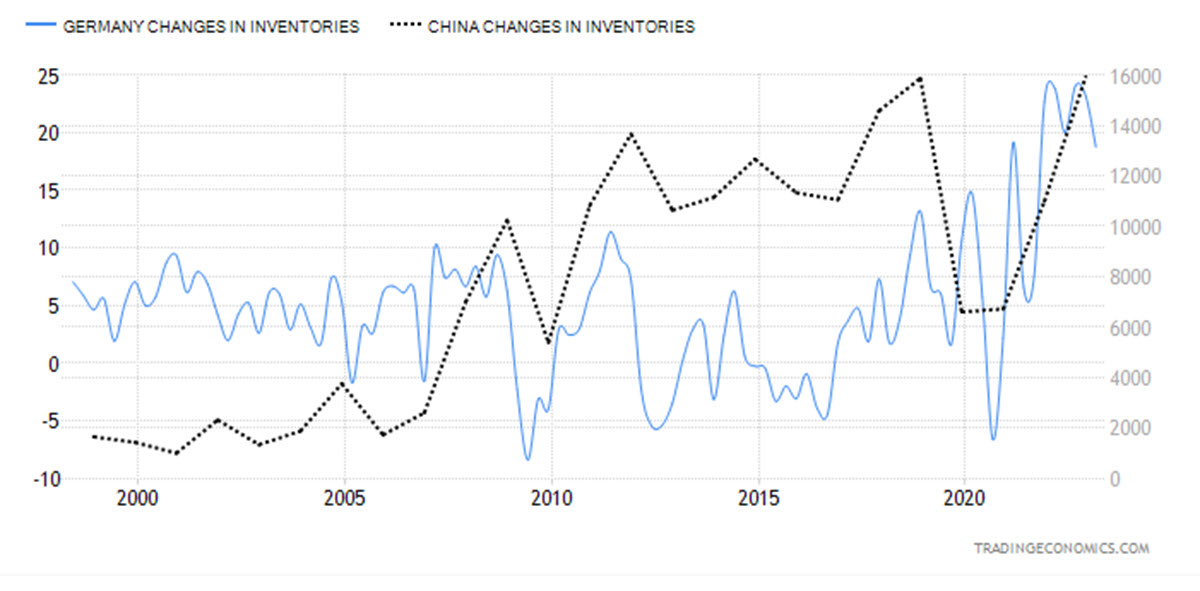
Inventories are very high: the amount of assets held by German companies at the end of Q1 was EUR 18.75 billion, the highest since the series began being published in the early 1990s. The same can be said of Chinese companies, whose inventories are also close to historical highs (although – probably for logistical reasons – a higher level is structural in this case) and in the US, where they have been growing at an average of about 1.5% per month during 2022 and are only now stopping doing so. If warehouses are full, there is no point in continuing to increase production and new orders are a good leading indicator of a slower economy than business previously forecasted.
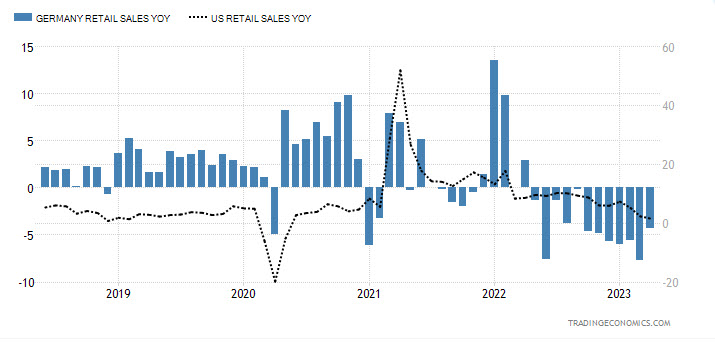
The fact is that the Consumer situation in Germany is really bad, with Retail Sales in free fall for 12 consecutive months (-4.3% in May). Perhaps in the US, where the consumer accounts for two-thirds of total GDP, this figure was not so bad, but the downward trend is very clear and we are now at a standstill, with sales growing only 1.4% in April 2023. Add to this the fact that retail sales are expressed in nominal terms (price * volume): if the price rises by 6% – to give an example – and they remain unchanged, this means that volumes have fallen by 6%. Finally, consider that Consumer Credit is growing again (26.51 billion in March 2023, up from 15 billion the previous month) and with it the use of Credit Cards (+17.3% and a ATH of 573 million Credit Card Accounts), while the Savings Rate is falling: in short, people are buying more and more every day with borrowed money.
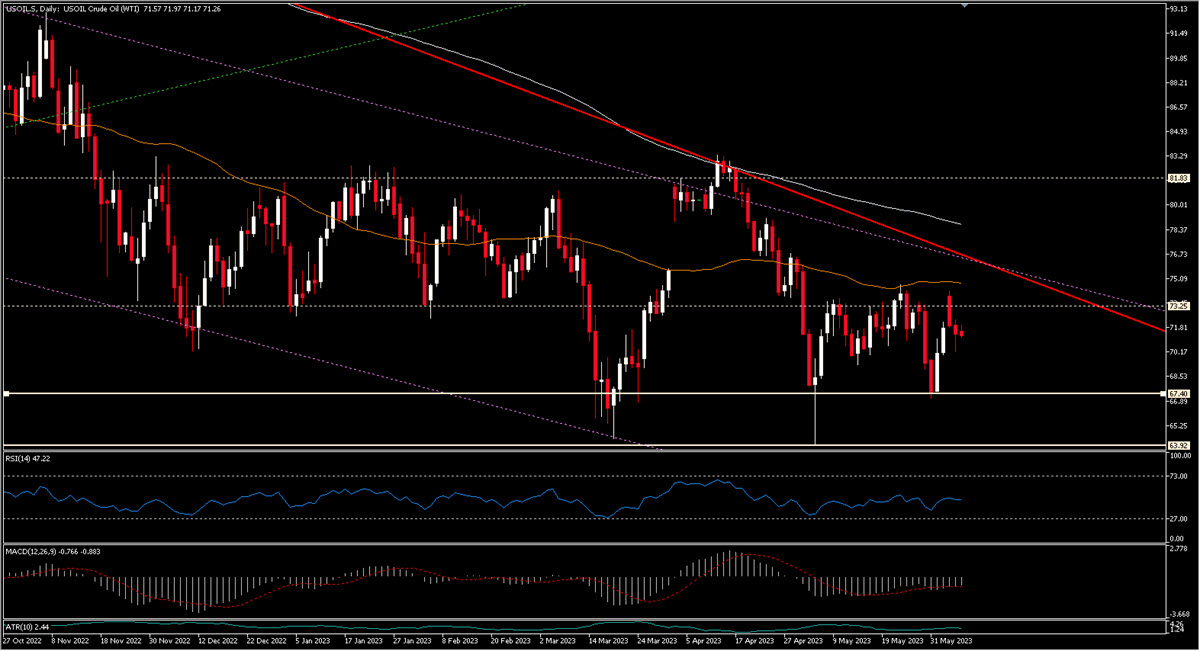
There is a lot of talk about a soft landing, about the possibility of advanced economies avoiding a recession in the coming months, and this optimism is maybe also due to the fact that share prices have recovered strongly (new annual high for the SP500 yesterday). But perhaps we should be more cautious in this regard and remain alert to certain signals (and not only to the 2y10y US curve inverted by an astonishingly high 83 bps). Indeed, a commodity so linked to growth as oil is, continues to be weak, despite a further cut of 1 million barrels per day to the production announced by the Saudis – and only by them – at the latest OPEC+ meeting last weekend. 4.66 million barrels per day have been cut from August 2022 to today, 4.6% of the world demand, and the price is still falling. Tomorrow we will see the crude oil chart and technicals in more detail, for now, notice the still declining trend and the gigantic importance of first $67.5 followed by the $64 area.
Crude Oil, Daily
Click here to access our Economic Calendar
Marco Turatti
Market Analyst
Disclaimer: This material is provided as a general marketing communication for information purposes only and does not constitute an independent investment research. Nothing in this communication contains, or should be considered as containing, an investment advice or an investment recommendation or a solicitation for the purpose of buying or selling of any financial instrument. All information provided is gathered from reputable sources and any information containing an indication of past performance is not a guarantee or reliable indicator of future performance. Users acknowledge that any investment in Leveraged Products is characterized by a certain degree of uncertainty and that any investment of this nature involves a high level of risk for which the users are solely responsible and liable. We assume no liability for any loss arising from any investment made based on the information provided in this communication. This communication must not be reproduced or further distributed without our prior written permission.


