


After touching the $2075 area for the third time since 2020, Gold started to correct and currently trades at $1960, a 5.70% drop from the highs. In the past 2 weeks, support in the $1940 area has held but rebounds have been capped around the $1975 area.
The highly correlated – though not leading – asset Silver is drawing a long term pattern where it is showing more weakness: here we do not see a triple high from the top in the $29.85 area in 2020, but rather descending highs (the current price is $24.15, 19% lower than the 2020-2021 highs).
Silver, not showing any Triple Top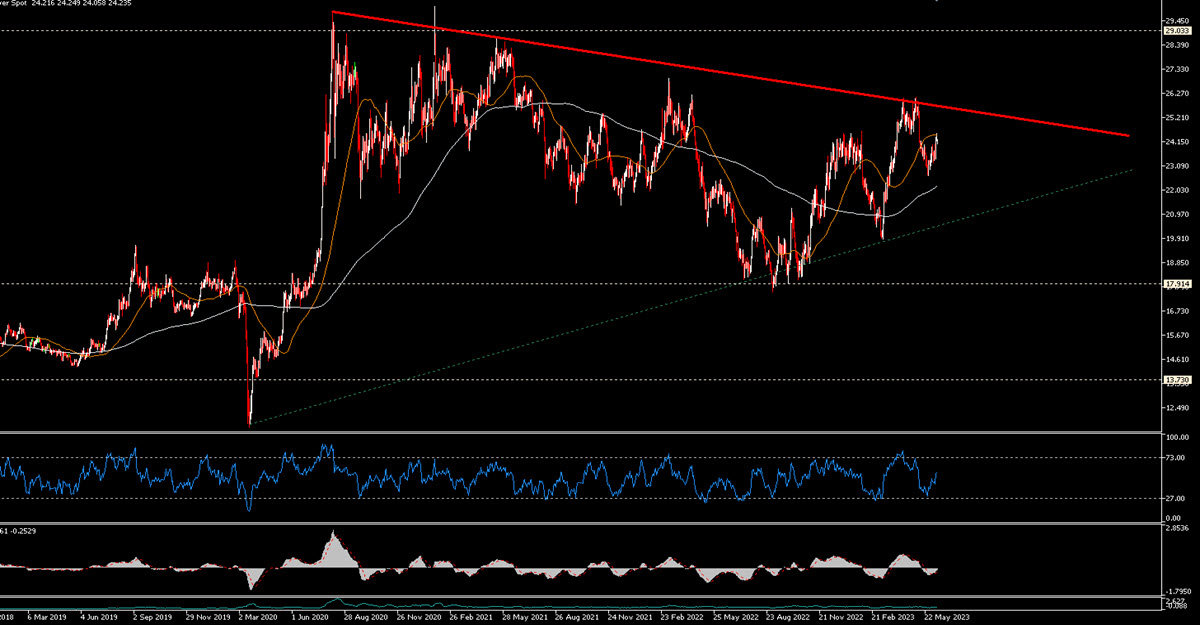
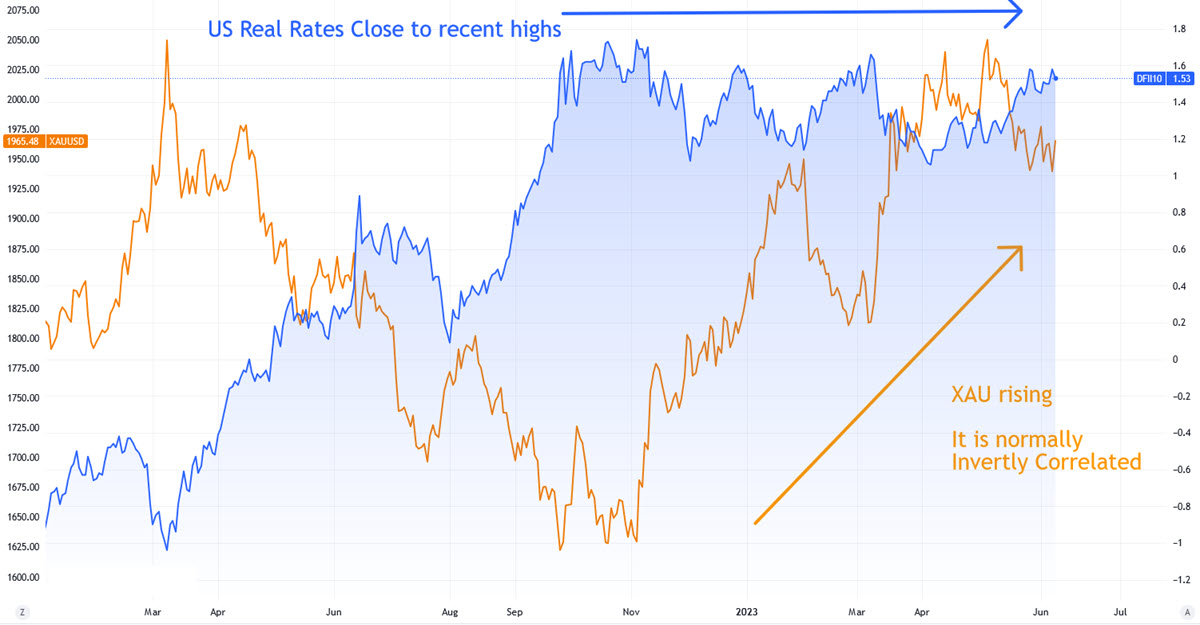
Even more interesting is the already reported divergence with real interest rates in the US economy, with which Gold has the strongest and most stable long-term inverse correlation, even more than against the USD itself: they have remained essentially sideways over the past 9 months, now trading at 1.751%, as they did in October 2022. At that time Gold was trading below $1,700 per troy oz.
US Real Rates (Blue) vs Gold spot price
Technical Analysis
Very interesting is the fact that the clearest and most immediate trendline, the one which started in Oct2022 and was tested in Mar2023 is passing exactly where the price is these days: 2 weeks ago it was perfectly tested, last Wednesday it was broken at the close ($1940) but immediately recovered the next day. Today that trend passes between $1953 and $1958: Gold is trading at $1960. The bearish trend generated at the beginning of May passes instead by $1975, which is also an area of resistance. Above this level it could turn positive again, with a necessary confirmation above $1985 and $1990, where the Daily MA50 passes.
Gold, Daily

To the downside, inability to maintain the bullish trend over the next few days would again lead to a test of $1940, this time with a weakened price pattern. In the case of a break-up we would have to wait for a confirmation below $1930 but then there could be some space downwards: first of all the important area $1900 but further weakness should not be excluded which could lead to the Daily MA200 (aprox $1850) and probably even lower. Given the fundamentals in terms of relative value (real rates) Gold could reach < $1,800 in the coming weeks.
In any case, nothing happens in a straight line and let’s not forget that this week is really packed with important Macro events that will move the market.
Click here to access our Economic Calendar
Marco Turatti
Market Analyst
Disclaimer: This material is provided as a general marketing communication for information purposes only and does not constitute an independent investment research. Nothing in this communication contains, or should be considered as containing, an investment advice or an investment recommendation or a solicitation for the purpose of buying or selling of any financial instrument. All information provided is gathered from reputable sources and any information containing an indication of past performance is not a guarantee or reliable indicator of future performance. Users acknowledge that any investment in Leveraged Products is characterized by a certain degree of uncertainty and that any investment of this nature involves a high level of risk for which the users are solely responsible and liable. We assume no liability for any loss arising from any investment made based on the information provided in this communication. This communication must not be reproduced or further distributed without our prior written permission.


