


America’s bank conglomerates – JPMorgan, Citigroup and Wells Fargo – shall deliver their Q2 2023 earnings result this Friday (14th July) before market open.


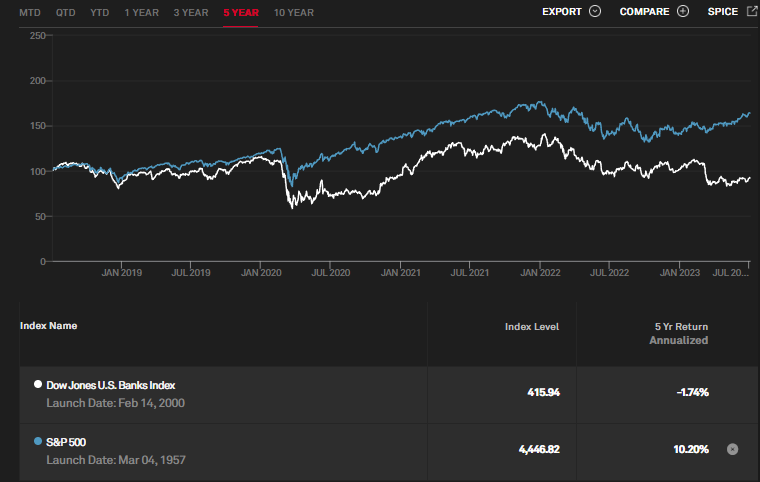
S&P500 & Dow Jones U.S. Banks Index Performance. Source: SPGlobal
In general, the Dow Jones US Banks Index has been subpar than S&P500 for the past five years, yielding a negative annualized return at -1.96%, with the latter yielding +9.77% (Also best H1 performance since 2019). YTD return for both indices are recorded at -9.89% and 14.57%, respectively. In March 2023, the decline of the Dow Jones US Banks Index was significant following the failure of US banks. However, the index ticked higher recently after major lenders cleared the Fed’s annual stress test, coupled with raised expectations over further rate hikes by the central bank (could the positive sentiment be erased soon following recent NFP data which performed below expectations?).
JPMorgan
JPMorgan is the world’s largest bank by market capitalization (over $410B). It offers a range of financial and investment banking services and products in all capital markets, including advising on corporate strategy and structure, capital raising in equity and debt markets, risk management, market making in cash securities and derivative instruments, brokerage and research.
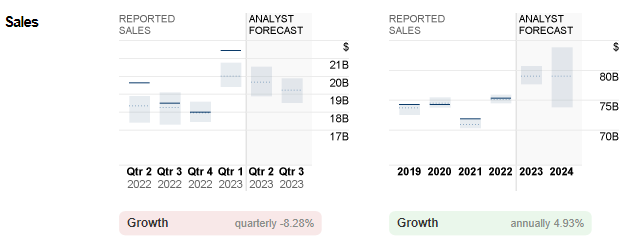
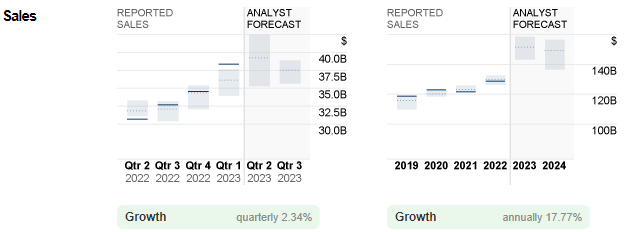 JPMorgan sales: Reported versus Analyst Forecast. Source: CNN Business
Last year, JPMorgan reported sales reached a record high at $128.7B, up over 5.7% from 2021. This marked the seventh annual consecutive sales gains for the firm. Total net income hit $37.7B, below 2021 ($48.3B).
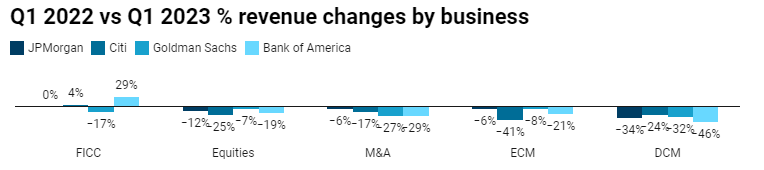
Revenue Changes by Business: JPMorgan and its Peers. Source: efinancialcareers
In Q1 2023, the bank displayed resilience fundamentally (solid trading volumes, investment banking fees, net interest margins and income from mortgage banking), which led to reported sales hitting $39.2B, up over 27% from the same period last year. By comparison, JPMorgan performed better than Citi equities sales and trading, M&A advisory and equity capital markets (ECM). On the other hand, JPMorgan outperformed Bank of America in every category except the fixed income currencies and commodities (FICC). All in all, the US banking institution remains healthy in general, proven by the Fed’s stress test conducted recently.
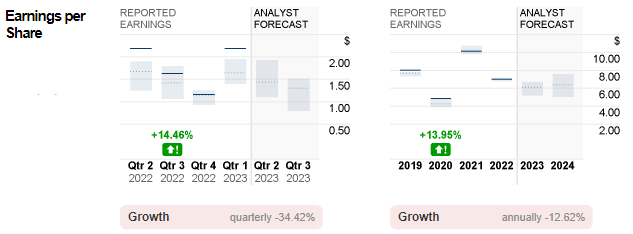
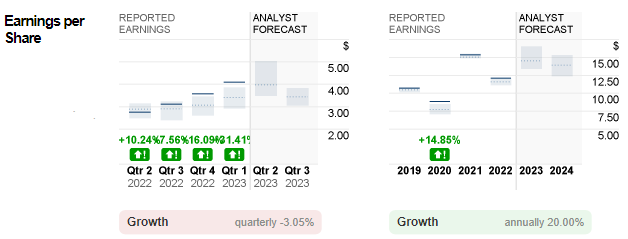 JPMorgan EPS: Reported versus Analyst Forecast. Source: CNN Business
EPS of JPMorgan in 2022 was down -21% from 2021, to $12.09. In Q1 2023, reported EPS of the firm was $4.10, compared to the $2.63 figure in the same period last year.
Higher interest rates may serve as a positive catalyst for the banks (Indeed, this will be another case if damage from loan losses is too severe). Analysts forecast JPMorgan’s sales to hit $39.2B in the coming announcement, up 2.35% from the previous quarter and up 27.7% from the same period last year. Expectation for EPS stood at $3.94, as compared to $4.10 in the previous quarter and $2.76 in Q2 2022.
Citigroup
Citigroup, formed by the merger of banking giant Citicorp and financial conglomerate Travelers Group in 1998, has a market capitalization over $88B. It operates through Global Consumer Banking (traditional banking services for retail customers), Institutional Clients Group (fixed income and equity research, sales and trading, foreign exchange, prime brokerage, derivative services, investment banking and advisory services, private banking, trade finance and securities services), and Corporate and Other (include un-allocated costs of global staff functions, other corporate expenses, un-allocated global operations and technology expenses).
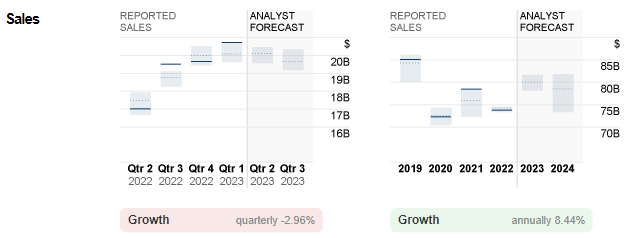
 Citigroup Sales: Reported versus Analyst Forecast. Source: CNN Business
Reported sales of Citigroup last year generally met market expectation, at $75.3B. This is still the best performance ever since 2015. On the contrary, net income stood at $14.85B, down over -32% from 2021, but still more than 34% above 2020.
In Q1 2023, its sales jumped 12% (y/y) and 19% (q/q) to $21.4B. Driven by higher revenue (boosted by strength across Services and Fixed Income Markets, and strong average loan growth in US Personal Banking), its net income has amounted to $4.6B, up 7% from a year ago.
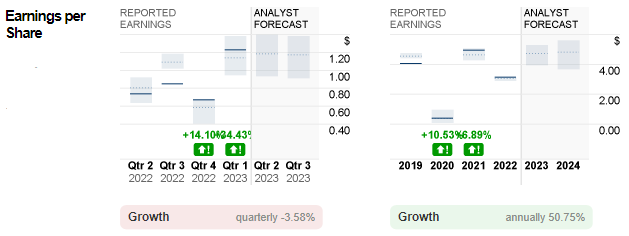
 Citigroup EPS: Reported versus Analyst Forecast. Source: CNN Business
EPS of Citigroup hit $7.00, down -31% from the previous year. In Q1 2023, its EPS leaped to $2.19 (was $2.02 and $1.16 respectively in Q1 and Q4 2022).
In the coming quarter, analysts forecast the sales of Citigroup to hit $19.5B, down nearly -9% from the previous quarter, and slightly below that in Q2 2022 ($19.6B). On the other hand, EPS is expected to be down over -36% (both quarterly and annually) to $1.39.
Wells Fargo
Wells Fargo, a diversified and community-based financial services company, is also engaged in the provision of banking, investments, insurance, mortgage products and services, as well as consumer and commercial finance. It is ranked 5th by market capitalization (over $160B).
Wells Fargo Sales: Reported versus Analyst Forecast. Source: CNN Business
Total sales revenue of Wells Fargo were below $80B for the past three years ($74.26B, $78.49B and $73.79B from 2020 to 2022). Besides the Covid-19 pandemic and deteriorating economy headwinds, a series of internal issues (federal regulatory fines, fake accounts scandal, outstanding litigation, customer remediation, etc) also hit the bank.
Nevertheless, in Q1 2023, Wells Fargo reported $20.7B in sales revenue, much above consensus estimates ($20.1B, versus $19.7B in Q4 2022). Net income was also up over 30% (y/y) to nearly $5.0B.
Wells Fargo EPS: Reported versus Analyst Forecast. Source: CNN Business
EPS was reported at $3.14 in 2022, down over -36% from a year ago. In Q1 2023, its EPS hit $1.23 (was $0.88 and $0.67 respectively in Q1 and Q4 2022). Analysts forecast the sales of the bank in the coming earnings announcement to slightly down to $20.1B, while EPS is expected to reach $1.18.
Technical Analysis:
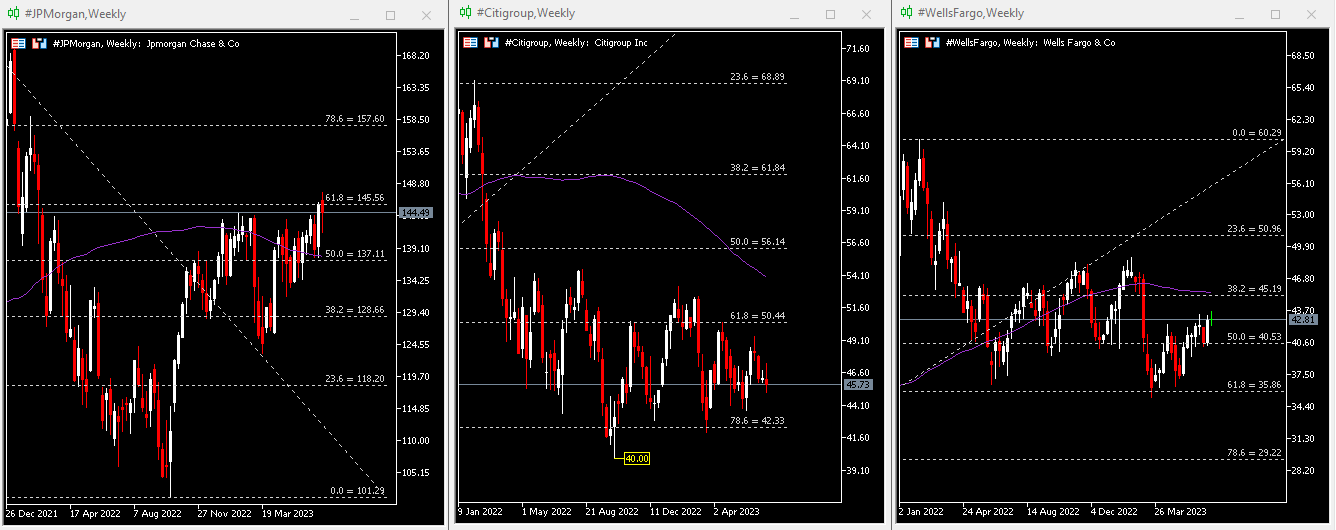
On the weekly chart, #JPMorgan (JPM.s) traded above 100-week SMA, currently testing FR 61.8% at $146. A close above this level may indicate continuous correction of the downtrend extended from October 2021-2022. $158 (FR 78.6%) would be the next resistance to watch. Otherwise, if the bullish breakout is unsuccessful, the 100-week SMA which will intersect with FR 50.0% at $137 which remains the nearest support to watch, followed by $129 (FR 38.2%).
#Citigroup (C.s) remains pressured below 100-week SMA, while it has remained range-bound below $55 since Q2 2022. It hit $40 in October last year, which was the lowest since May 2020. Prior to this support, the firm’s share price may need to test $42 (FR 78.6%). Otherwise, any rebound will keep resistance $50 (FR 61.8%) in focus, followed by the 100-week SMA and $56 (FR 50.0%).
#WellsFargo (WFC.s) traded higher since gaining ground in the first quarter this year, with lows at $35.25. By the end of Q2 2023, the firm’s share price closed above $40.50, or FR 50.0%. It may still need to overcome resistance at $45, the 100-week SMA and also a trend line formed by the highs seen in Feb 2022 and Feb 2023, to begin another uptrend. As long as these levels remain unbroken, downside pressure remains, with $40.50 (FR 50.0%) serving as the nearest support, followed by $36 (FR 61.8%) and $29 (FR 78.6%).
Click here to access our Economic Calendar
Larince Zhang
Market Analyst
Disclaimer: This material is provided as a general marketing communication for information purposes only and does not constitute an independent investment research. Nothing in this communication contains, or should be considered as containing, an investment advice or an investment recommendation or a solicitation for the purpose of buying or selling of any financial instrument. All information provided is gathered from reputable sources and any information containing an indication of past performance is not a guarantee or reliable indicator of future performance. Users acknowledge that any investment in Leveraged Products is characterized by a certain degree of uncertainty and that any investment of this nature involves a high level of risk for which the users are solely responsible and liable. We assume no liability for any loss arising from any investment made based on the information provided in this communication. This communication must not be reproduced or further distributed without our prior written permission.


