


From electrical switches and solar panels to chemical-producing catalysts, silver is an essential component in many industries. It is malleable and ductile, making it perfect for jewelry and silverware. Silver is also one of the world’s best conductors of electricity, allowing its use in electronic components and micro-electronic devices.
Its unique properties make it nearly impossible to substitute and its uses span a wide range of applications. Almost every computer, mobile phone, automobile and appliance contains silver. The precious metal is in demand for many green technologies: electric vehicles use almost twice as much silver as internal combustion engines; solar panels contain it, and their installation is growing. 5G/mobile phone technology uses silver.
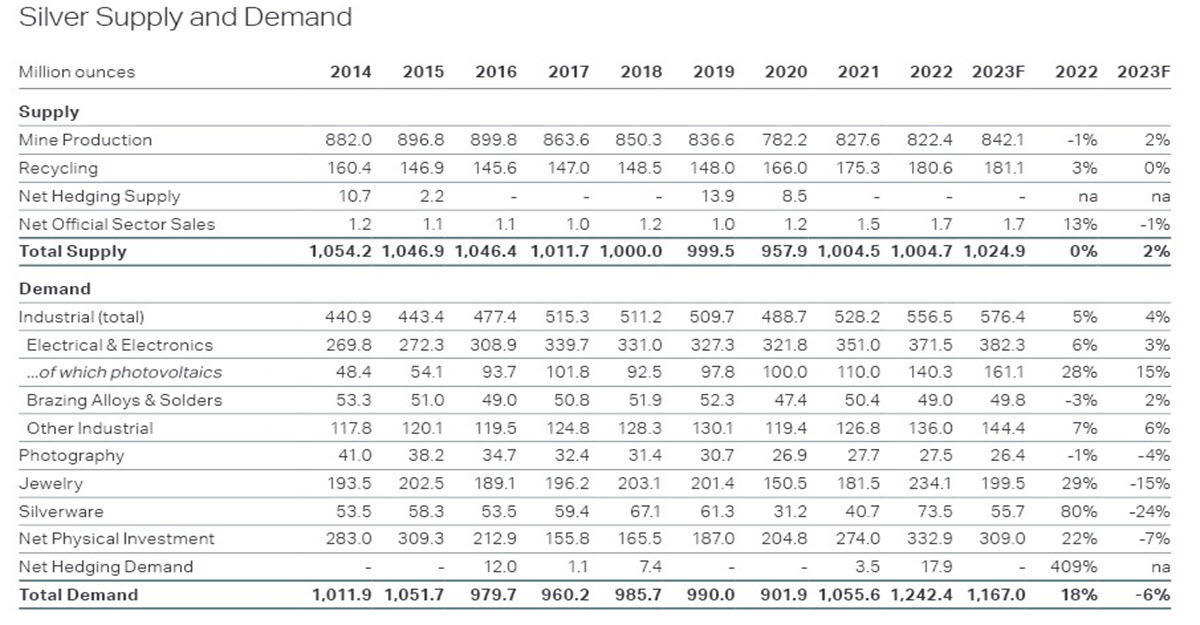
This growth in industrial demand should support the silver price going forward: in 2022 it was a whopping 556 million ounces. But also Investment demand for physical XAG – which fluctuates every year – grew 18% to 332 million ounces last year (despite the largest annual decline in ETF holdings). Above is a table showing supply and demand for the precious metal, courtesy of The Silver Institute.
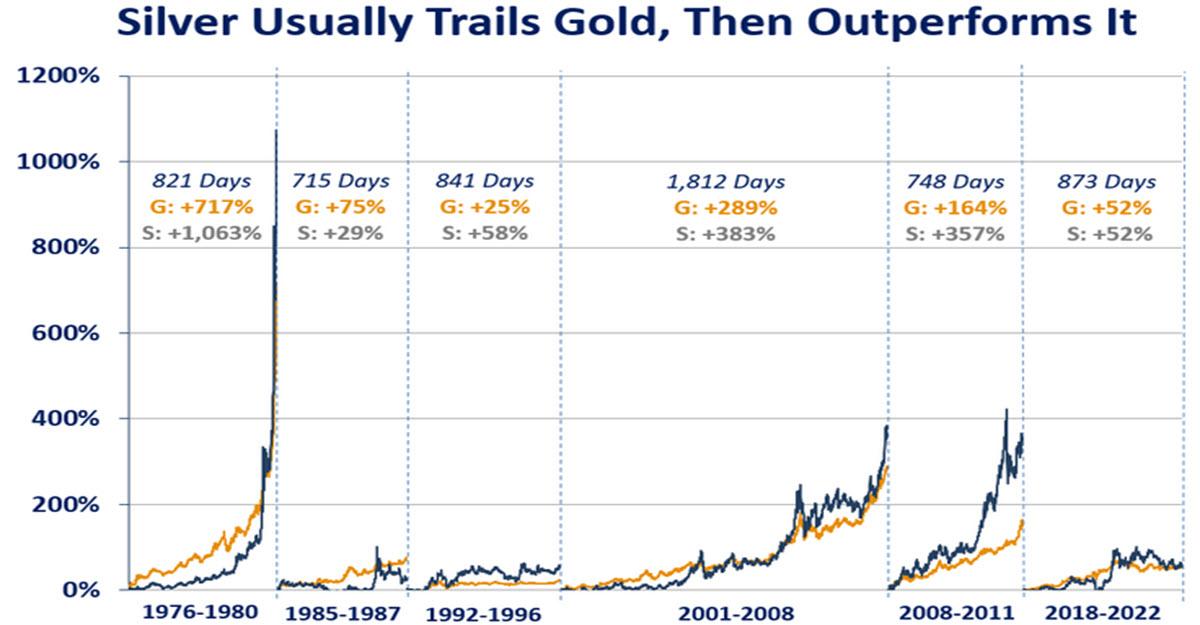
In terms of price movements and volatility, silver has a strong relationship with gold – among others -although it tends to have a rather higher Beta (it moves more, during some bull markets up to 2.5x times more).
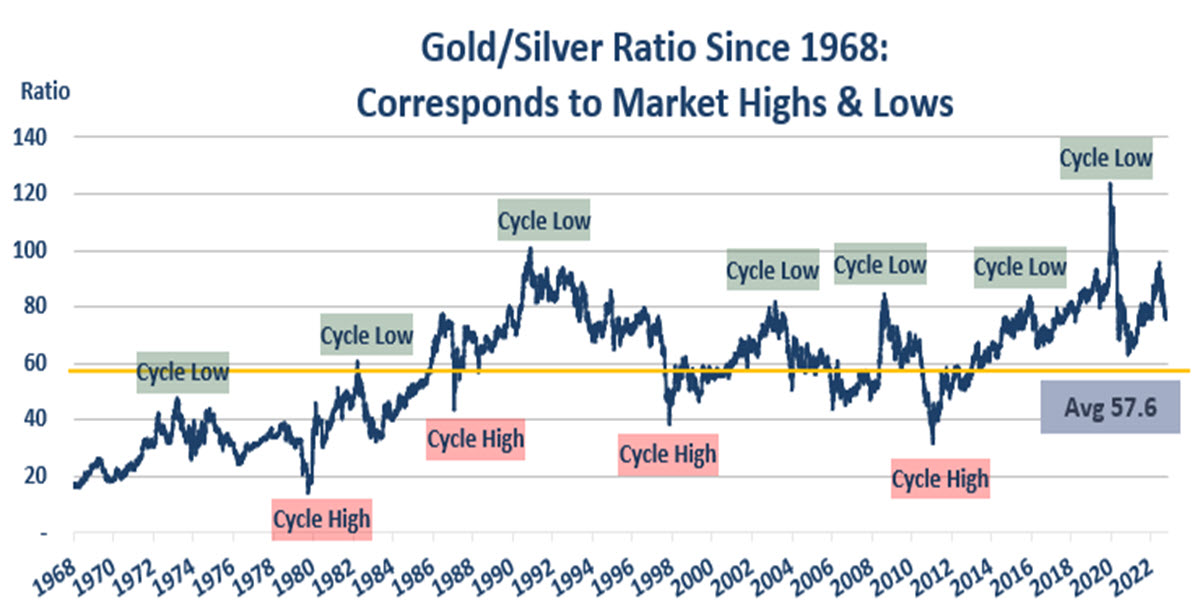
The Gold/Silver ratio – which we can see below – is famous and often considered: it is simply the ratio between the two metals and has averaged 57.6 over the last 55 years (gold is many times more expensive than its shiny little cousin). During the last 5 years every time it has touched the 90 zone it has been strongly rejected: it currently stands at 83.72 after having touched 91.4 at the beginning of March. This is a level 45% higher than the 57.6 average.
Technical Analysis
From a technical perspective, it has caught our eye because, like gold but perhaps more clearly, it is now attacking the descending trendline which began in April 2023: the reaction will be interesting, as at the moment it is difficult to draw indications from indicators such as RSI (47.86) or Moving Averages (the price is between MA50 and MA200, <$1 apart); if the price is actually pushed down, the area of $21.55 aprox will be an important target and support, having already been such in 2021 and 2022. Not too much lower, close to $21, passes the possible bullish trend of this very long term pennant.
If the downtrend were to be breached there would probably be room even up to around $24.50 to start and probably up to $25.30 in the mid-term.

But both the 10-year real interest rates are at new highs in the 1.815% area and the dynamics of the Gold/Silver ratio probably go against this second possibility despite the promising demand dynamics.
Click here to access our Economic Calendar
Marco Turatti
Market Analyst
Disclaimer: This material is provided as a general marketing communication for information purposes only and does not constitute an independent investment research. Nothing in this communication contains, or should be considered as containing, an investment advice or an investment recommendation or a solicitation for the purpose of buying or selling of any financial instrument. All information provided is gathered from reputable sources and any information containing an indication of past performance is not a guarantee or reliable indicator of future performance. Users acknowledge that any investment in Leveraged Products is characterized by a certain degree of uncertainty and that any investment of this nature involves a high level of risk for which the users are solely responsible and liable. We assume no liability for any loss arising from any investment made based on the information provided in this communication. This communication must not be reproduced or further distributed without our prior written permission.


