Apple reported its earnings results a few days ago and they were a disappointment, especially on the sales side. Without going over the results of this quarter, the third, in detail, we would like to highlight the trend here: the Cupertino giant’s sales were down by -$1.16 billion compared to Q3 2022, and if we want to make an unfair comparison, in Q1 the company tends to post the highest sales of the year – they were -$35.35 billion compared to Q1. EBITDA was -$1.71 billion y/y and -$5.17 billion from last quarter’s result. EPS, while beating expectations, was -2.3% from last year.
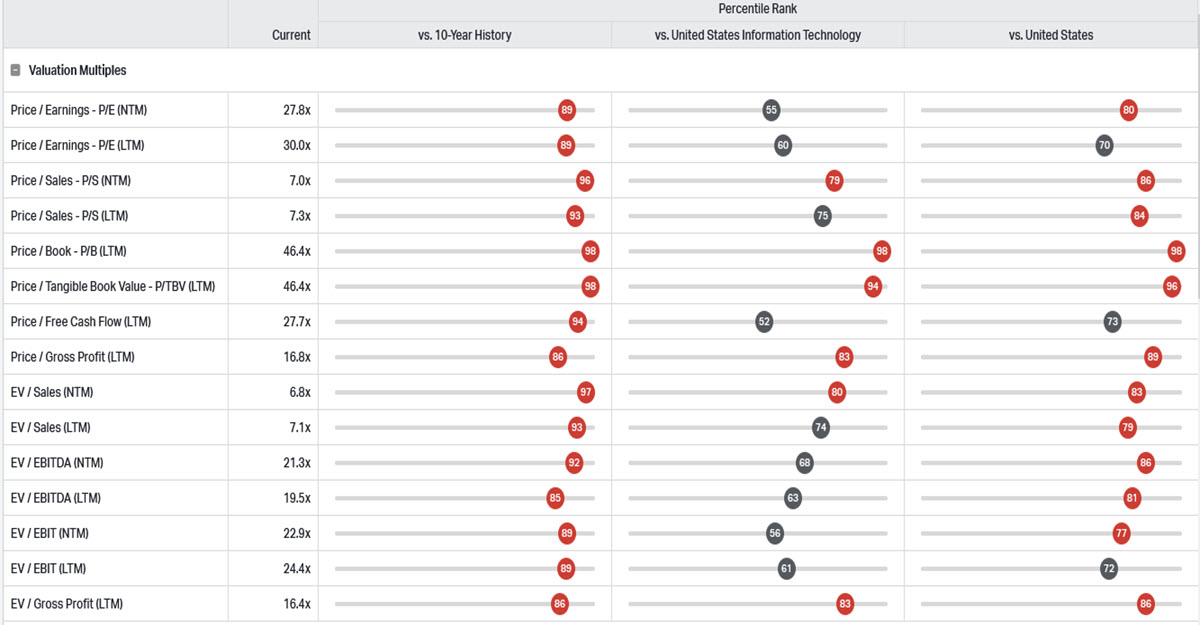
AAPL Valuations and Percentiles
Virtually ALL metrics (P/E, P/S, EV/Sales, EV/EBITDA, P/B) are above the 90th percentile of the last 10 years of the stock’s history. Despite this, the share has been rising, to as high as 53.01% YTD during the 19 July session. At yesterday’s close, that intraday high of $198.23 is 9.78% away. And the pain – most likely – is not over.
Technical analysis
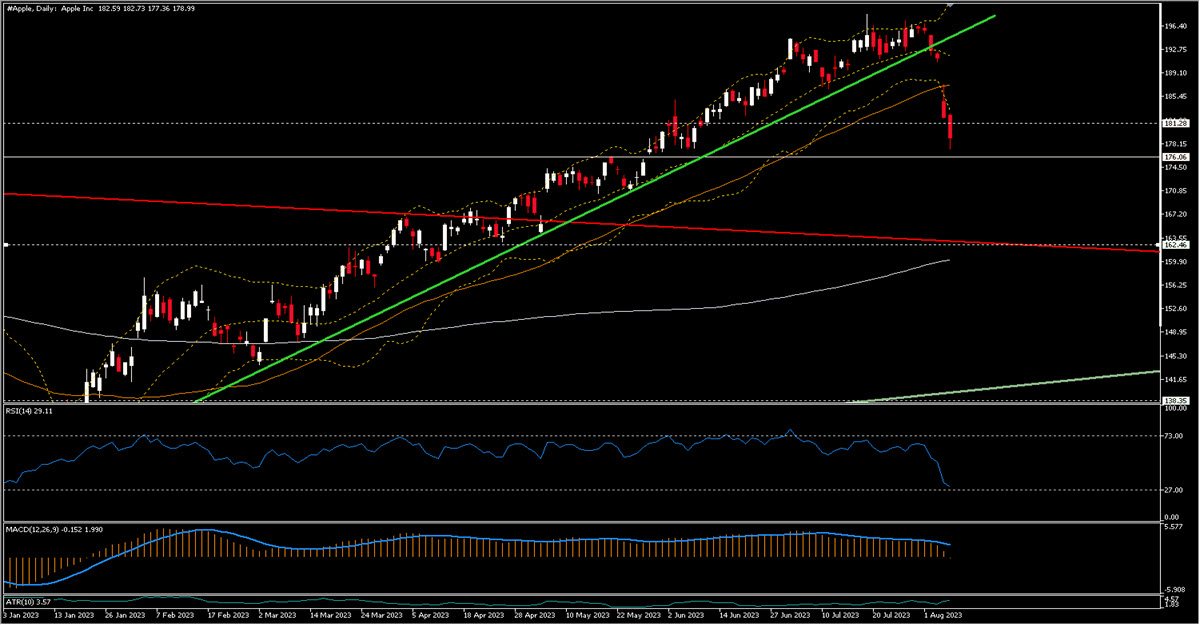
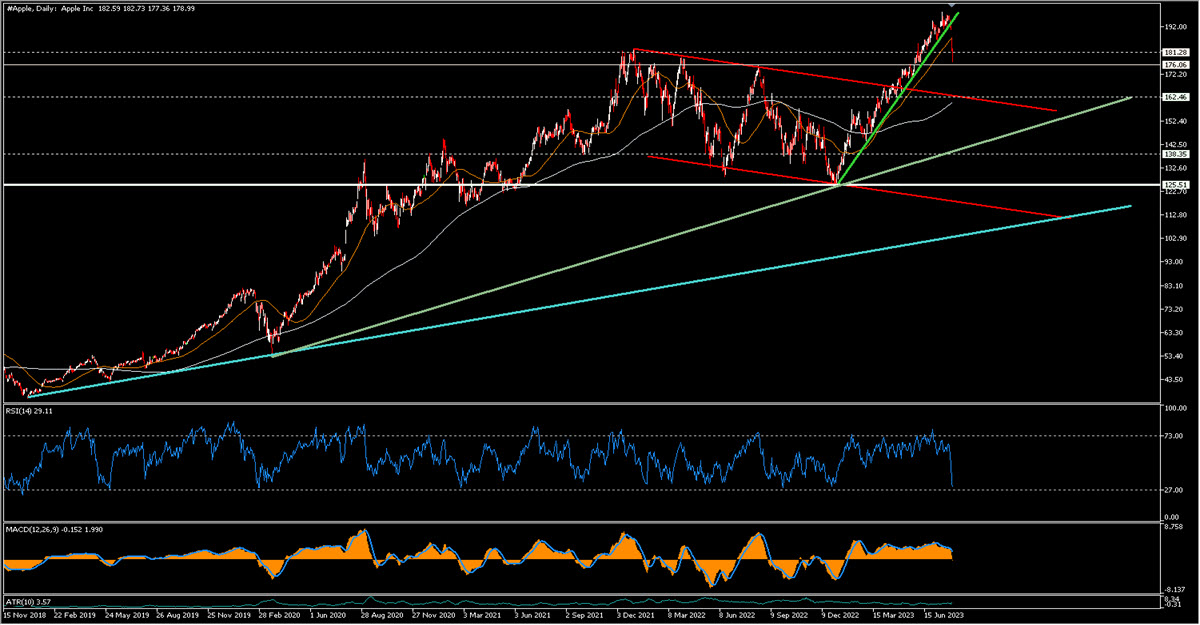
As you can see from the daily chart, the post-earnings fall was very strong: most interesting is the very clear breakout (at $193) of the trendline that had supported the price so far this year. At the moment, the stock price is trading below the MA50, the MACD is negatively skewed and the RSI has fallen deeply after having been in divergence for months (sideways against a price that continued to rise with impetus) but it is not oversold in any case. The rally from May onwards had also found impetus in the upward break-up of what had been the broad, slightly descending channel within which prices had moved in 2022. As of today, the upper part of that channel is at $163.50, not far from where the MA200 ($160.36) currently passes.
$181 approx. could have been an initial support (the highs of 2021) but it has been crushed; $176 is another interesting area which will be followed by $171. However, the bearish movement has already started and chasing it now after such an abrupt movement that has also cut the BBs with conviction is a bit risky and any entry should be monitored at least in the short term. We believe that the most likely short term outcome is an attempt to bounce off the next supports mentioned above (i.e. 1.5% and 4.25% lower than yesterday’s close respectively) and it is plausible that the price will stay between the two long term moving averages in the coming weeks (the MA200 is about 10% lower at the moment and the MA50 4.5% higher). There is no point in looking further ahead for now, but the continued success of the current products (physical or service) plus the launch and success of the new ones (the Vision Pro, for example) will probably determine whether the stock will still have the strength to push higher or will start to grow at a more moderate long-term pace.
Click here to access our Economic Calendar
Marco Turatti
Market Analyst
Disclaimer: This material is provided as a general marketing communication for information purposes only and does not constitute an independent investment research. Nothing in this communication contains, or should be considered as containing, an investment advice or an investment recommendation or a solicitation for the purpose of buying or selling of any financial instrument. All information provided is gathered from reputable sources and any information containing an indication of past performance is not a guarantee or reliable indicator of future performance. Users acknowledge that any investment in Leveraged Products is characterized by a certain degree of uncertainty and that any investment of this nature involves a high level of risk for which the users are solely responsible and liable. We assume no liability for any loss arising from any investment made based on the information provided in this communication. This communication must not be reproduced or further distributed without our prior written permission.


